 Global| Feb 29 2008
U.S. Real Disposable Income Up 0.1%, Spending Flat, Core Price Gains Faster
by:Tom Moeller
|in:Economy in Brief
Summary
Adjusted for prices, disposable personal income squeaked out a 0.1% gain last month. The weak rise followed a like increase in December but two months of decline preceding that. It left the three-month growth rate at a negative 0.7% [...]
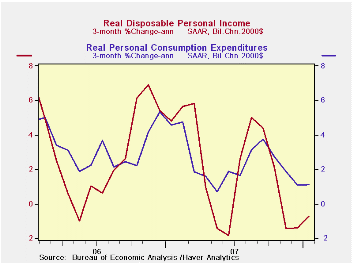
Adjusted for prices, disposable personal income squeaked out a 0.1% gain last month. The weak rise followed a like increase in December but two months of decline preceding that. It left the three-month growth rate at a negative 0.7% (AR).
Nominal personal income slightly beat Consensus expectations last month with a 0.3% rise and three-month growth in income held steady at a 4.1% annual rate. Wage & salary income rose 0.5% (4.1% y/y) after firm gains during the two prior months. Factory sector wages, however, were flat (+0.6% y/y) while wage & salary income in the private service-providing industries rose 0.5% (4.7% y/y). Wages in the government sector rose a strong 0.9% (4.7% y/y).
Lower interest rates caused the forth straight monthly decline in interest income (+5.2% y/y). That y/y increase was less than one third the rate of gain at the end of 2005. Dividend income rose another firm 0.5% (11.9% y/y), a double digit rate of gain that is down somewhat from its peak 16.3% in 2006.
Weakness in income growth caught up with personal spending.
During the last two months, real personal consumption
expenditures have been flat. As a result the three-month
growth rate held at 1.1%, its lowest since last May. Nominal spending
grew 0.4% which was double the expected increase.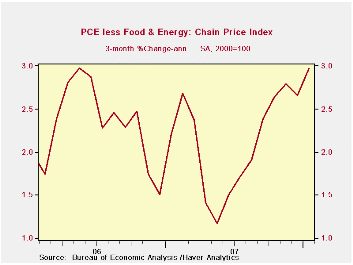
Real spending on discretionary items weakened substantially led by a 3.3% (-5.3% y/y) drop in motor vehicle & parts purchases. Real spending on household furniture & appliances also fell 0.4% (+4.4% y/y) for the second consecutive month of decline. Spending on apparel did post a 0.3% (0.1% y/y) in January but that followed four months of either having been unchanged or down, including a 1.9% downdraft during December.
Spending in the less discretionary area continued to show growth. Medical care spending rose 0.2% (2.7% y/y) and spending on transportation services rose 0.2% (3.1% y/y). Spending on food, however, fell 0.2% (+0.7% y/y) during January. These and other detailed spending figures are available in Haver's USNA database.
The PCE chain price index rose a firm 0.4% lifted by higher energy prices. That raised the y/y gain to 3.7%, the quickest since mid-2005. The rise in the core PCE price index was ahead of expectations. A 0.3% gain beat expectations for a 0.2% rise but, more significant, was an acceleration in the three month growth rate to 3.0% that was its fastest since late 2001 and up by half from last year.
Overview: Monetary Policy and the Economic Outlook from the Federal Reserve's Monetary Report to Congress can be found here.
| Disposition of Personal Income | January | December | Y/Y | 2007 | 2006 | 2005 |
|---|---|---|---|---|---|---|
| Personal Income | 0.3% | 0.5% | 4.9% | 6.1% | 6.6% | 5.9% |
| Personal Consumption | 0.4% | 0.3% | 5.5% | 5.5% | 5.9% | 6.2% |
| Saving Rate | -0.1% | -0.1% | 0.6% (Jan. 07) | 0.4% | 0.4% | 0.5% |
| PCE Chain Price Index | 0.4% | 0.3% | 3.7% | 2.6% | 2.8% | 2.9% |
| Less food & energy | 0.3% | 0.2% | 2.2% | 2.1% | 2.2% | 2.2% |
by Tom Moeller February 29, 2008
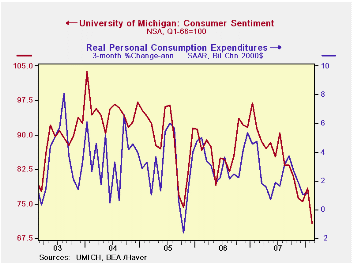
For all of February the University of Michigan's consumer sentiment index fell just 9.7% to a level of 70.8. That decline was a little better than the 11.2% plunge from January reported at mid-month. It also was better than the reading of 70 that had been generally expected. Nevertheless, it was the largest m/m decline since 2005 and it was to the lowest level since early 1992.
Opinions about government policy continued down sharply. The 11.5% m/m (-21.6% y/y) decline was deeper than initially indicated and dropped the measure of opinions to the lowest level since 1993. Just 9% of those surveyed indicated that they thought government was doing a good job and 40% indicated that a bad job was being done.
The index of expected business conditions during the next year improved very slightly from the preliminary reading but it still fell a hard 8.4% m/m, to its lowest level since just after the recession of 1990. Expectations for business conditions during the next five years fell 5.7% (-15.3% y/y) while expectations for personal finances reversed all of a January increase and fell 3.4%.
The current conditions index fell a bit more than initially
indicated. The 11.2% m/m drop was to the lowest level since 1992.
Current conditions for buying large household goods continued down
15.8% m/m to the lowest level since 1992. The view of current personal
finances also fell 4.1% (-21.0% y/y).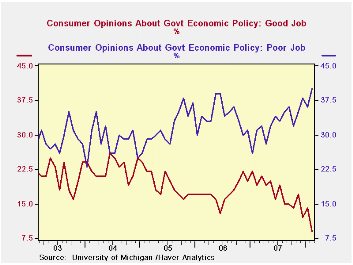
Expectations for inflation during the next twelve months fell just slightly to 3.9% but that still was up from a 3.6% expectation in February '07. For the next five to ten years expectations held steady at 3.4%.
The University of Michigan survey is not seasonally adjusted.The reading is based on telephone interviews with about 500 households at month-end; the mid-month results are based on about 300 interviews. The summary indexes are in Haver's USECON database, with details in the proprietary UMSCA database.
The Reaction of Consumer Spending and Debt to Tax Rebates – Evidence from Consumer Credit Data from the Federal Reserve Bank of Chicago can be found here.
| University of Michigan | Feb (Final) | Feb (Prelim. | Jan | Dec | Feb y/y | 2007 | 2006 | 2005 |
|---|---|---|---|---|---|---|---|---|
| Consumer Sentiment | 70.8 | 69.6 | 78.4 | 75.5 | -22.5% | 85.6 | 87.3 | 88.5 |
| Current Conditions | 83.8 | 85.4 | 94.4 | 91.0 | -21.5% | 101.2 | 105.1 | 105.9 |
| Expectations | 62.4 | 59.4 | 68.1 | 65.6 | -23.4% | 75.6 | 75.9 | 77.4 |
by Tom Moeller February 29, 2008
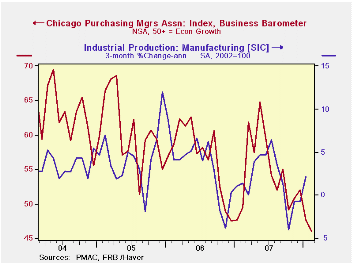
The Chicago Purchasing Manager's Association reported that its February business barometer dropped hard from January to a reading of 44.5, the lowest level since late 2001. The latest figure was quite a bit lower than Consensus expectations.
During the last ten years there has been a 66% correlation
between the index and the three-month change in US factory sector
industrial production. There has been an 85% correlation between the
Chicago figure and the national ISM index (due for release on Monday)
and that is the highest correlation of all the regional series with the
Nat'l index.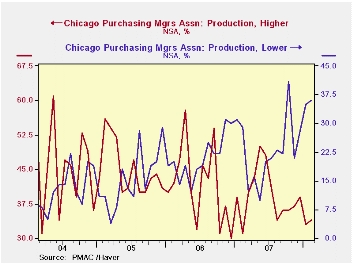
The new orders component of the index did rise slightly m/m, but most other component series fell quite hard. The employment index fell to its lowest since 2002 while the production series fell that sharply as well.
The prices paid index backed off just a bit from the January level which was a recent high, but the level remained at its highest since May 2006.
| Chicago PMI | February | January | Feb. '07 | 2007 | 2006 | 2005 |
|---|---|---|---|---|---|---|
| Chicago PMI Business Barometer Index | 44.5 | 51.5 | 49.4 | 54.4 | 56.8 | 60.4 |
by Robert Brusca February 29, 2008
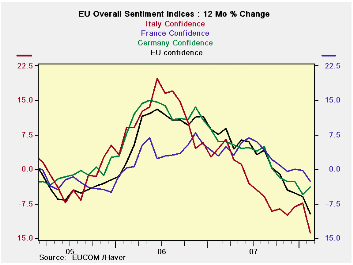
EU sentiment indexes are also lower year over year. In February the EU/EMU and all large countries' sentiment indexes fell except in Germany where a small bounce was recorded. Conditions in the UK (an EU member not an EMU member) deteriorated very sharply. Among EMU members Italy’s recent slide is the worst.
In percentile terms the ESI (EU sentiment index) stands in the 62nd percentile of its range, about 12 percentage points above its mid-point. That is still a solid expansionary reading. But, it has been slipping for eight straight months, although no single ESI component has fallen for that many months straight. The last two months show the percentage drops in the ESI have accelerated.
Services has the highest absolute net balance reading among ESI components but it is the relative lowest in terms of its percentile standing in its range (residing in the 31st percentile of range a very weak showing). Interestingly, despite concerns about the strong euro, the weakest sector is seemingly, the most trade insulated, services. However, there is another way to look at this since the service sector while having some items for which demand is relatively inelastic, like home services, probably also has a large degree of consumer discretionary items and it contains tourism, the latter is probably quite exchange rate sensitive. The demise of this sector may be reflecting the drop in consumer confidence which, in its 55th percentile, is weaker than any of the economic sectors, except services. Moreover, services are very weak in the UK, 8th percentile, and in Spain, 1.8 percentile. Tourism is important to Spain and the high euro could be taking a toll there. That is also true of Italy where the services sector is in the bottom 15 percent of its range.
Note none of the country specific ESI range readings are shown in the table below.
Retail confidence is relatively strong near the 80th percentile, but is at the 57th percentile in the UK, 50th percentile in Germany, and the 28th percentile in Spain. Oddly with all the weakness signaled in the various Italian reports the EMU retail index scores Italy in the 86th percentile for retailing.
The retailing results stands in marked contrast to consumer confidence which stands in the 38th percentile for Italy. Spain’s rating for the consumer is also in the 37th percentile. The UK stands in the 54th percentile and France in the 52nd percentile. German consumer responses are in the in the 67th percentile, relatively elevated for this group.
Industry is holding up partly due to investment demand in and around the euro area. Industry’s strongest component is export orders in the 84th percentile of their range. And while production expectations are at the 67th percentile and order volume is in the 82nd percentile the production trend expected is only in its 61st percentile. This sector’s strong reading may be living on borrowed time.
Employment expectations have taken a hit in the services sector. Expectations for employment grade out in the 44th percentile and current employment also grades out below 50 at the 44th percentile. Interestingly, retail and industrial sector employment expectations are around the 90th percentiles of their respective ranges.
In this cycle the ESI has taken the largest drop in the UK -20 points followed by Italy at -16.5 and Spain at -14. The EMU index is off by 11.0 points while France and Germany are off by 7.5 and 7.9 points respectively.
| EU Sectors and Country Level Overall Sentiment | |||||||||||
|---|---|---|---|---|---|---|---|---|---|---|---|
| EU | Feb 08 |
Jan 08 |
Dec 07 |
Nov 07 |
%tile | Rank | Max | Min | Range | Mean | R-Sq w/ Overall |
| Overall | 100.2 | 103.3 | 105.8 | 106.6 | 62.9 | 107 | 116 | 73 | 43 | 100 | 1.00 |
| Industrial | 0 | 2 | 2 | 3 | 79.4 | 53 | 7 | -27 | 34 | -7 | 0.88 |
| Consumer Confidence | -11 | -10 | -7 | -7 | 55.2 | 111 | 2 | -27 | 29 | -10 | 0.83 |
| Retail | 1 | -3 | 2 | 4 | 81.5 | 22 | 6 | -21 | 27 | -6 | 0.46 |
| Construction | -7 | -4 | -3 | -1 | 77.8 | 45 | 3 | -42 | 45 | -17 | 0.43 |
| Services | 6 | 11 | 15 | 14 | 31.6 | 106 | 32 | -6 | 38 | 17 | 0.81 |
| % m/m | Based on Level | Level | |||||||||
| EMU | -1.6% | -1.6% | -0.7% | -1.2% | 61.5 | 102 | 117 | 73 | 44 | 99 | 0.95 |
| Germany | 0.6% | -1.9% | -0.3% | 0.2% | 59.8 | 77 | 121 | 79 | 42 | 99 | 0.66 |
| France | -1.7% | -0.8% | -1.6% | -0.5% | 71.6 | 74 | 119 | 72 | 47 | 100 | 0.79 |
| Italy | -3.7% | -1.3% | 2.3% | -4.2% | 47.2 | 146 | 121 | 71 | 50 | 100 | 0.78 |
| Spain | -3.4% | -1.6% | -1.4% | -0.1% | 40.5 | 188 | 118 | 67 | 51 | 100 | 0.65 |
| Memo: UK | -8.7% | -2.2% | -1.0% | -4.5% | 52.3 | 156 | 118 | 69 | 50 | 100 | 0.42 |
| Since 1990 except Services (Oct 1996) 208 -Count Services: 126-Count | |||||||||||
| Sentiment is an index, sector readings are net balance diffusion measures | |||||||||||
by Robert Brusca February 29, 2008
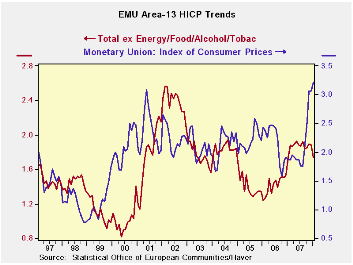
February has seen a now dollar low VS the Euro, a new high for gold and for other precious metals, as well as repeated new highs for oil prices. In January EMU prices are up by 0.3% with inflation accelerating in its sequential growth rates: up at a 4.8% pace for three months, at a 4.2% pace for six months, at a 3.2% pace for twelve months compared to a 1.9% pace over the previous twelve months. Even so the inflation picture is brightening up in Europe.
Despite ongoing pressures from oil and now food stuffs, the core inflation rate (that ECB goes out of its way to say it does not target) is behaving in a very positive fashion. In the last three months the core rate decelerated from a monthly rate of 0.3% in Nov to 0.2% in Dec to a 0.1% rise in January. Its three month rate of change is below its six month pace. Moreover, Germany, the largest EMU economy, shows that three month of core inflation decelerated while Spain and Italy show a lower three month than six month pace.
Apart from that sort of technical trend stuff, there is the gap between the headline rate and the core. That gap has widened sequentially for EMU and for each of the countries in the table below. Yet despite this greater pull of headline inflation pressures the three-month pace of inflation has improved in three of four of the countries as well as for EMU overall.
If headline inflation does not make core inflation worse, then when the headline stops taking its pounding from the special interest inflation categories, headline inflation will settle down rapidly and gravitate toward the core. So far there is very little evidence of a pass-through of inflation in Europe. But as long as the headline-to-core rate of inflation gap remains, expect the ECB to pound the market with anti-inflation rhetoric. At the moment it is concerned with the ongoing round of wage negotiations.
The ECB still may not be happy with these developments. Surely it is still wary of the strong increases in commodity prices and the strong growth in European money and credit aggregates. But German, Italian and Spanish inflation rates have come lower. Only France in this group has some mild inflation that may be taking hold. Ultimately this will undermine the ability of the French president and his finance minister to carp at the ECB. To the extent that France has tried to go its own way to and to pressure the ECB to support stronger growth, the French fiscal and domestic policy stance reveals inflation trends that remind us why the ECB should NOT be hostage to or influenced by national desires. Politicians usually have one objective: stronger growth. If it can be accompanied by low inflation, that’s fine. But for politicians it is not a goal. Yet they are the first to complain when inflation gets stoked and central banks must hike rates in response.
Only in Germany and a handful of other countries, do we find governments that persistently understand the importance of keeping inflation down and that do not try to jawbone the central bank. The ECB has its priorities straight: protect against inflation first and resist pressure. Now all we need is to get France’s Sarkozy to see the merits in this approach and maybe the ECB can be even more effective. There is nothing like having someone of influence chewing away at your independence to undermine it. What we see amid this potential inflation bubble is how well the ECB has acquitted itself so far despite the pitfalls and the pressures… We can be optimistic for the time being but the game is still engaged; it’s too soon to declare a victory.
| Trends in HICP | |||||||
|---|---|---|---|---|---|---|---|
| % mo/mo | % saar | ||||||
| Jan-08 | Dec-07 | Nov-07 | 3-Mo | 6-Mo | 12-Mo | Yr Ago | |
| EMU-13 | 0.3% | 0.2% | 0.7% | 4.8% | 4.2% | 3.2% | 1.9% |
| Core | 0.1% | 0.2% | 0.3% | 2.5% | 2.7% | 2.3% | 1.8% |
| Goods | -0.5% | 0.1% | 1.0% | 2.0% | 4.8% | 3.7% | 1.5% |
| Services | -0.2% | 0.9% | -0.1% | 2.4% | 0.4% | 2.5% | 2.3% |
| HICP | |||||||
| Germany | 0.3% | -0.2% | 1.0% | 4.3% | 3.7% | 3.0% | 1.8% |
| France | 0.3% | 0.4% | 0.7% | 5.9% | 4.6% | 3.2% | 1.4% |
| Italy | 0.1% | 0.4% | 0.4% | 3.5% | 3.9% | 3.1% | 1.9% |
| Spain | 0.2% | 0.5% | 0.8% | 6.5% | 5.8% | 4.4% | 2.5% |
| Core: xFE&A | |||||||
| Germany | -0.2% | 0.3% | 0.4% | 1.9% | 2.0% | 2.1% | 1.8% |
| France | 0.3% | 0.3% | 0.3% | 3.5% | 3.1% | 2.2% | 1.4% |
| Italy | 0.0% | 0.3% | 0.2% | 1.9% | 2.7% | 2.5% | 1.6% |
| Spain | 0.2% | 0.3% | 0.3% | 3.3% | 4.1% | 3.2% | 2.7% |

Tom Moeller
AuthorMore in Author Profile »Prior to joining Haver Analytics in 2000, Mr. Moeller worked as the Economist at Chancellor Capital Management from 1985 to 1999. There, he developed comprehensive economic forecasts and interpreted economic data for equity and fixed income portfolio managers. Also at Chancellor, Mr. Moeller worked as an equity analyst and was responsible for researching and rating companies in the economically sensitive automobile and housing industries for investment in Chancellor’s equity portfolio. Prior to joining Chancellor, Mr. Moeller was an Economist at Citibank from 1979 to 1984. He also analyzed pricing behavior in the metals industry for the Council on Wage and Price Stability in Washington, D.C. In 1999, Mr. Moeller received the award for most accurate forecast from the Forecasters' Club of New York. From 1990 to 1992 he was President of the New York Association for Business Economists. Mr. Moeller earned an M.B.A. in Finance from Fordham University, where he graduated in 1987. He holds a Bachelor of Arts in Economics from George Washington University.
More Economy in Brief


