 Global| Mar 18 2008
U.S. PPI Total & Total Firm
by:Tom Moeller
|in:Economy in Brief
Summary
Finished producer prices in the U.S. rose 0.3% during February following a 1.0% surge in January. The latest increase fell just short of Consensus expectations for a 0.4% rise but the 6.8% increase versus last February was near this [...]
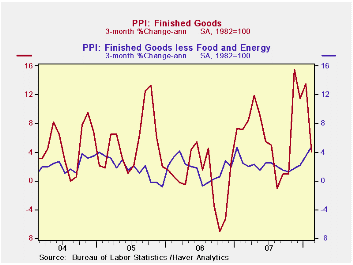
Finished producer prices in the U.S. rose 0.3% during February following a 1.0% surge in January. The latest increase fell just short of Consensus expectations for a 0.4% rise but the 6.8% increase versus last February was near this cycle's high. Moreover it was well up from the 3.9% increase during all of last year.
Less food and energy the 0.5% increase in prices was quite a bit stronger than expectations for a 0.2% gain. While the y/y increase held roughly steady at 2.5% the annualized rate of growth during the last three months surged to 4.7%, about the fastest in ten years.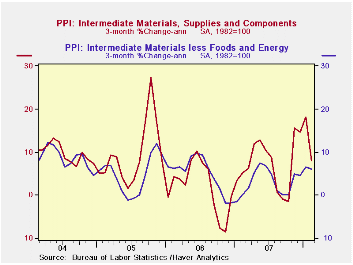
Energy prices rose 0.8% (20.7% y/y) and added to the prior month's 1.5% surge. Gasoline prices rose 2.9% for the second consecutive month (43.2% y/y) though home heating oil prices fell 3.7% (+36.8% y/y). Natural gas prices jumped 5.7% (5.3% y/y).
Why Do Gasoline Prices React to Things That Have Not Happened? from the Federal Reserve Bank of St. Louis is available here.
Finished consumer food prices fell 0.5% (+6.0% y/y) and gave back just a piece of the 1.7% January surge. During the past three months food prices have risen at a 10.8% annual rate.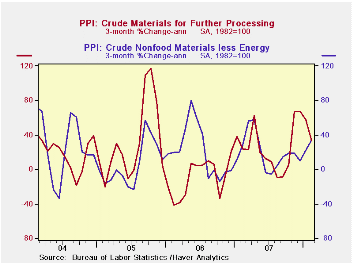
Prices of core finished consumer goods rose 0.5% (2.5% y/y). That gain was well ahead of expectations for a 0.2% increase and it raised the three month change to 4.7% (AR). Passenger car prices rose 0.8% (1.2% y/y). Capital equipment prices rose a firm 0.5% (1.9% y/y) led by a 0.8% rise in prices of light trucks (0.1% y/y).
Intermediate goods prices rose 0.8% following the 1.4% January surge. Excluding food & energy prices were strong again and posted a 0.6% increase. Industrial chemical prices remained quite firm and rose 17.8% from last year.
The crude materials PPI surged again during February. A 3.7% rise followed the 2.5% jump during January. Crude energy materials prices jumped another 5.6% (30.2% y/y). The core crude materials PPI also was quite firm and posted a 3.3% gain. Prices for iron & steel scrap are up 34.5% y/y and copper base scrap prices are 25.1% higher y/y.
| Producer Price Index (%) | February | January | Y/Y | 2007 | 2006 | 2005 |
|---|---|---|---|---|---|---|
| Finished Goods | 0.3 | 1.0 | 6.8 | 3.9 | 3.0 | 4.9 |
| Core | 0.5 | 0.4 | 2.5 | 1.9 | 1.5 | 2.4 |
| Intermediate Goods | 0.8 | 1.4 | 9.1 | 4.1 | 6.4 | 8.0 |
| Core | 0.6 | 0.8 | 4.8 | 2.8 | 6.0 | 5.5 |
| Crude Goods | 3.7 | 2.5 | 24.6 | 12.2 | 1.4 | 14.6 |
| Core | 3.3 | 4.0 | 20.6 | 15.9 | 20.8 | 4.9 |

Tom Moeller
AuthorMore in Author Profile »Prior to joining Haver Analytics in 2000, Mr. Moeller worked as the Economist at Chancellor Capital Management from 1985 to 1999. There, he developed comprehensive economic forecasts and interpreted economic data for equity and fixed income portfolio managers. Also at Chancellor, Mr. Moeller worked as an equity analyst and was responsible for researching and rating companies in the economically sensitive automobile and housing industries for investment in Chancellor’s equity portfolio. Prior to joining Chancellor, Mr. Moeller was an Economist at Citibank from 1979 to 1984. He also analyzed pricing behavior in the metals industry for the Council on Wage and Price Stability in Washington, D.C. In 1999, Mr. Moeller received the award for most accurate forecast from the Forecasters' Club of New York. From 1990 to 1992 he was President of the New York Association for Business Economists. Mr. Moeller earned an M.B.A. in Finance from Fordham University, where he graduated in 1987. He holds a Bachelor of Arts in Economics from George Washington University.
More Economy in Brief


