Global| Aug 18 2009
U.S. PPI Posts Broad-Based Decline With Energy Prices Leading The Fall
by:Tom Moeller
|in:Economy in Brief
Summary
Pricing power reflected the weakness in the U.S. economy last month as the PPI for finished goods fell 0.9%. That reversed half of the 1.8% jump during June and left prices down 6.4% from the year ago level. The decline also was [...]
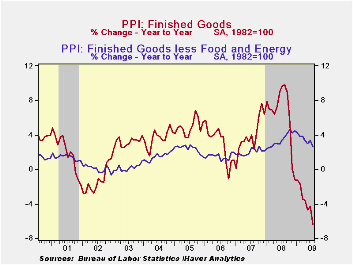 Pricing power reflected the weakness in the U.S. economy last
month as the PPI for finished goods fell 0.9%. That reversed half of
the 1.8% jump during June and left prices down 6.4% from the year ago
level. The decline also was deeper than Consensus expectations for a
0.3% drop. In addition, a 0.1% decline in PPI less food &
energy contrasted with expectations for a 0.1% increase. That decline
pulled the y/y change to 2.6% which was the weakest increase since
early 2008.
Pricing power reflected the weakness in the U.S. economy last
month as the PPI for finished goods fell 0.9%. That reversed half of
the 1.8% jump during June and left prices down 6.4% from the year ago
level. The decline also was deeper than Consensus expectations for a
0.3% drop. In addition, a 0.1% decline in PPI less food &
energy contrasted with expectations for a 0.1% increase. That decline
pulled the y/y change to 2.6% which was the weakest increase since
early 2008.
 Lower energy prices led the decline in last month's PPI with a
2.4% drop (-29.6% y/y) after increases during the prior two months. The
July decline was led by a 10.2% fall in gasoline prices (-45.1% y/y)
which reversed most of the increase during June. Working the other way,
natural gas prices firmed again last month and posted a 3.3% (-30.9%
y/y) increase.
Lower energy prices led the decline in last month's PPI with a
2.4% drop (-29.6% y/y) after increases during the prior two months. The
July decline was led by a 10.2% fall in gasoline prices (-45.1% y/y)
which reversed most of the increase during June. Working the other way,
natural gas prices firmed again last month and posted a 3.3% (-30.9%
y/y) increase.
The PPI for finished consumer goods less food & energy fell by 0.1% (+3.1% y/y) after a firm 0.5% jump during June. Finished durables prices reversed most of the June gain with a 0.5% decline (+2.7% y/y). Posting a moderate increase were prices of core finished nondurable goods. They gained 0.4% and the y/y increase of 3.5% is off from the 5.9% rise as of the end of last year. Capital equipment prices also reflected the weakness in demand and fell 0.2%. That pulled the y/y increase to 1.9% after a 4.3% rise as of last December.
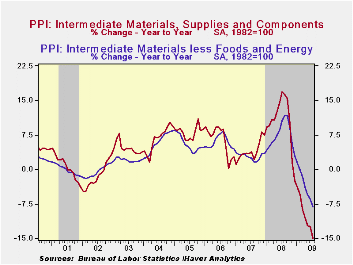
 Prices for intermediate goods ticked 0.2% lower led by a 2.0%
decline in food prices (-15.0% y/y). That decline was in addition to a
1.4% drop (-34.5% y/y) in energy prices. Less food & energy,
intermediate goods prices ticked 0.2% higher for only the second
increase since last September.
Prices for intermediate goods ticked 0.2% lower led by a 2.0%
decline in food prices (-15.0% y/y). That decline was in addition to a
1.4% drop (-34.5% y/y) in energy prices. Less food & energy,
intermediate goods prices ticked 0.2% higher for only the second
increase since last September.
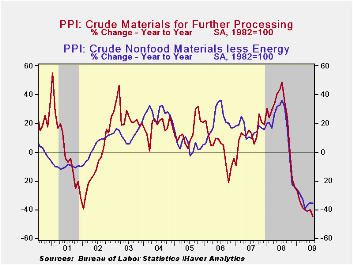
The crude materials PPI reversed all of its June increase with a 4.5% decline. That was led by a 6.1% (-25.7% y/y) drop in food prices and a 6.2% decline in crude energy prices (-59.6% y/y). Core pricing power at the crude level improved for the third straight month and posted a 2.9% increase.
The producer price data is available in Haver's USECON database. More detailed data is in the PPI and in the PPIR databases.
| Producer Price Index (%) | July | June | Y/Y | 2008 | 2007 | 2006 |
|---|---|---|---|---|---|---|
| Finished Goods | -0.9 | 1.8 | -6.4 | 6.4 | 3.9 | 2.9 |
| Core | -0.1 | 0.5 | 2.6 | 3.4 | 2.0 | 1.5 |
| Intermediate Goods | -0.2 | 1.9 | -15.0 | 10.5 | 4.0 | 6.4 |
| Core | 0.2 | 0.4 | -8.2 | 7.4 | 2.8 | 6.0 |
| Crude Goods | -4.5 | 4.6 | -45.0 | 21.4 | 11.9 | 1.4 |
| Core | 2.9 | 2.6 | -35.7 | 14.8 | 15.6 | 20.8 |

Tom Moeller
AuthorMore in Author Profile »Prior to joining Haver Analytics in 2000, Mr. Moeller worked as the Economist at Chancellor Capital Management from 1985 to 1999. There, he developed comprehensive economic forecasts and interpreted economic data for equity and fixed income portfolio managers. Also at Chancellor, Mr. Moeller worked as an equity analyst and was responsible for researching and rating companies in the economically sensitive automobile and housing industries for investment in Chancellor’s equity portfolio. Prior to joining Chancellor, Mr. Moeller was an Economist at Citibank from 1979 to 1984. He also analyzed pricing behavior in the metals industry for the Council on Wage and Price Stability in Washington, D.C. In 1999, Mr. Moeller received the award for most accurate forecast from the Forecasters' Club of New York. From 1990 to 1992 he was President of the New York Association for Business Economists. Mr. Moeller earned an M.B.A. in Finance from Fordham University, where he graduated in 1987. He holds a Bachelor of Arts in Economics from George Washington University.
More Economy in Brief