 Global| Nov 17 2009
U.S. PPI Increases 0.3% Fueled By Food & Energy Prices
by:Tom Moeller
|in:Economy in Brief
Summary
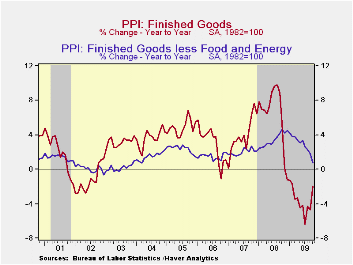
Inflationary pressures continued to be diffused last month by the weak economy, but they increased for those who eat or drive a car. The PPI for finished goods rose 0.3% during October following declines during two of the prior three [...]
 Inflationary
pressures continued to be diffused last month by the weak economy, but
they increased for those who eat or drive a car. The PPI for finished
goods rose 0.3% during October following declines during two of the
prior three months. The increase fell somewhat short of Consensus
expectations for a 0.5% rise. Though the PPI continued to decline
versus the year-ago level, the 1.9% drop is a moderation from the 6.4%
y/y decline back in July. Much of that moderation is due to notably
sharp price declines during last year's fourth quarter.
Inflationary
pressures continued to be diffused last month by the weak economy, but
they increased for those who eat or drive a car. The PPI for finished
goods rose 0.3% during October following declines during two of the
prior three months. The increase fell somewhat short of Consensus
expectations for a 0.5% rise. Though the PPI continued to decline
versus the year-ago level, the 1.9% drop is a moderation from the 6.4%
y/y decline back in July. Much of that moderation is due to notably
sharp price declines during last year's fourth quarter.
The increase in overall producer prices last month was led by a 1.6% (-2.5% y/y) rise in food & beverage prices which reflected the third monthly surge (NSA) in fruit & vegetable prices (15.2% y/y), a one-quarter spike in fresh & dry vegetable prices (-6.7% y/y) and higher dairy product prices (-11.3% y/y). A 1.6% increase in finished energy prices added to that monthly pressure, though prices still were down 9.4% y/y. Here again, however, the y/y comparisons are similar to those for food & beverage prices. Though prices remained 9.4% lower than last year, the twelve-month comparison has moderated from -29.6% this past July as monthly price declines during last year's fourth quarter were notably sharp. Despite m/m increases, gasoline prices remained down 12.5% y/y, fuel oil prices were off by one-third and natural gas prices were 20.1% lower.
 Excluding
food
& energy prices the PPI fell 0.6% during October. Not only was
the decline the third in the last four months, the 0.7% y/y increase
was the weakest since early-2004. The m/m decline in the core PPI
contrasted with expectations for a 0.1% increase. The PPI for finished
consumer goods less food & energy fell 0.5% yet gained 1.1%
y/y. That was the weakest annual increase since July 2007. Finished
durables prices cratered by 1.2% (0.0% y/y), and prices of core
finished consumer nondurable goods rose a modest 0.2%. The 2.0% y/y
increase was down from 5.9% as of last November. Capital equipment
prices also reflected economic weakness and fell 0.7%, the third
decline in the last four months. That pulled the y/y increase down to
0.1% after a 4.3% rise as of last December.
Excluding
food
& energy prices the PPI fell 0.6% during October. Not only was
the decline the third in the last four months, the 0.7% y/y increase
was the weakest since early-2004. The m/m decline in the core PPI
contrasted with expectations for a 0.1% increase. The PPI for finished
consumer goods less food & energy fell 0.5% yet gained 1.1%
y/y. That was the weakest annual increase since July 2007. Finished
durables prices cratered by 1.2% (0.0% y/y), and prices of core
finished consumer nondurable goods rose a modest 0.2%. The 2.0% y/y
increase was down from 5.9% as of last November. Capital equipment
prices also reflected economic weakness and fell 0.7%, the third
decline in the last four months. That pulled the y/y increase down to
0.1% after a 4.3% rise as of last December.
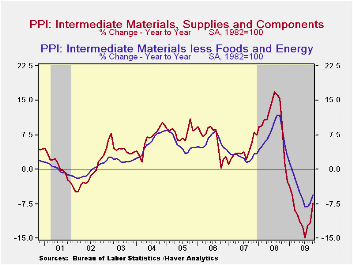
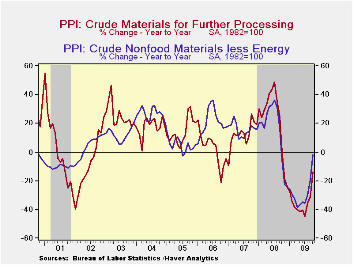 Prices for
intermediate
goods rose 0.3% due to higher energy prices. The increase contrasted,
however, with a 0.2% decline in core prices. These were led by declines
in textile, chemical & lumber prices. Intermediate food prices
fell 0.2% (-8.4% y/y). The crude materials PPI increased a
sizable 5.4% due to the increase in energy prices though they still
remained down by nearly one-quarter from last October. In contrast,
core prices showed strength and increased for the seventh straight
month reflecting the steady rise in commodity prices.
Prices for
intermediate
goods rose 0.3% due to higher energy prices. The increase contrasted,
however, with a 0.2% decline in core prices. These were led by declines
in textile, chemical & lumber prices. Intermediate food prices
fell 0.2% (-8.4% y/y). The crude materials PPI increased a
sizable 5.4% due to the increase in energy prices though they still
remained down by nearly one-quarter from last October. In contrast,
core prices showed strength and increased for the seventh straight
month reflecting the steady rise in commodity prices.
The producer price data is available in Haver's USECON database. More detailed data is in the PPI and in the PPIR databases.
Short-Term Headline-Core Inflation Dynamics from the Federal Reserve Bank of Richmond is available here
| Producer Price Index(%) | October | September | August | Y/Y | 2008 | 2007 | 2006 |
|---|---|---|---|---|---|---|---|
| Finished Goods | 0.3 | -0.6 | 1.7 | -1.9 | 6.4 | 3.9 | 2.9 |
| Core | -0.6 | -0.1 | 0.2 | 0.7 | 3.4 | 2.0 | 1.5 |
| Intermediate Goods | 0.3 | 0.2 | 1.8 | -7.5 | 10.5 | 4.0 | 6.4 |
| Core | -0.2 | 0.9 | 0.6 | -5.6 | 7.4 | 2.8 | 6.0 |
| Crude Goods | 5.4 | -2.1 | 3.8 | -13.9 | 21.4 | 11.9 | 1.4 |
| Core | 0.5 | 3.6 | 6.0 | -1.5 | 14.8 | 15.6 | 20.8 |

Tom Moeller
AuthorMore in Author Profile »Prior to joining Haver Analytics in 2000, Mr. Moeller worked as the Economist at Chancellor Capital Management from 1985 to 1999. There, he developed comprehensive economic forecasts and interpreted economic data for equity and fixed income portfolio managers. Also at Chancellor, Mr. Moeller worked as an equity analyst and was responsible for researching and rating companies in the economically sensitive automobile and housing industries for investment in Chancellor’s equity portfolio. Prior to joining Chancellor, Mr. Moeller was an Economist at Citibank from 1979 to 1984. He also analyzed pricing behavior in the metals industry for the Council on Wage and Price Stability in Washington, D.C. In 1999, Mr. Moeller received the award for most accurate forecast from the Forecasters' Club of New York. From 1990 to 1992 he was President of the New York Association for Business Economists. Mr. Moeller earned an M.B.A. in Finance from Fordham University, where he graduated in 1987. He holds a Bachelor of Arts in Economics from George Washington University.
More Economy in Brief


