 Global| Sep 18 2007
U.S. PPI Fell Sharply; Core Prices Tame, Food Down, Oil Cratered
by:Tom Moeller
|in:Economy in Brief
Summary
Finished producer prices fell 1.4%, the most for any month since October of last year. That followed a 0.6% increase during July and dropped the year to year percent change to 2.1%, its lowest since January. A 0.3% decline had been [...]
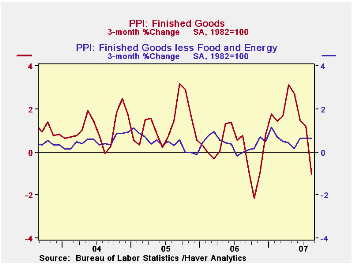
Finished producer prices fell 1.4%, the most for any month since October of last year. That followed a 0.6% increase during July and dropped the year to year percent change to 2.1%, its lowest since January. A 0.3% decline had been expected for August.
Food prices fell 0.2% (+4.7% y/y) for the fourth consecutive monthly decline led by lower prices for pork.
Energy prices cratered 6.6% after the 2.5% surge during the prior month. Gasoline prices fell 13.8% (-5.7% y/y) and home heating oil prices fell 6.0% (-4.5% y/y).Natural gas prices reversed the prior month's strength with an 8.5% decline (-4.5% y/y).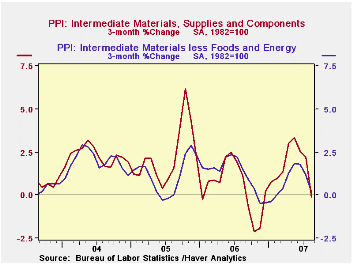
The core finished goods PPI increased a moderate 0.2% which was double the expected 0.1% uptick. The increase matched the average monthly rise of 0.2% so far this year.
Passenger car prices increased 0.5% but household furniture prices fell a modest 0.2% for the second monthly decline.
Capital equipment prices rose 0.1% for the second consecutive month. the modest increase led by a 0.9% decline in prices of light motor trucks.
Intermediate goods prices dropped 1.2% as the index excluding food & energy prices fell 0.5%, the first m/m decline since last November.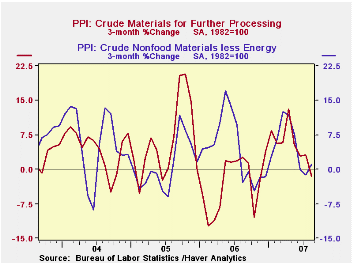
The crude materials PPI reversed all of the prior month's increase with a 3.0% drop as food prices fell 1.4%, reversing all of the prior month's increase. The core crude materials PPI jumped 1.4% on the strength of iron & steel scrap prices.
| Producer Price Index | August | July | Y/Y | 2006 | 2005 | 2004 |
|---|---|---|---|---|---|---|
| Finished Goods | -1.4% | 0.6% | 2.1% | 2.9% | 4.9% | 3.6% |
| Core | 0.2% | 0.1% | 2.2% | 1.4% | 2.4% | 1.5% |
| Intermediate Goods | -1.2% | 0.6% | 2.2% | 6.4% | 8.0% | 6.6% |
| Core | -0.5% | 0.2% | 2.5% | 6.0% | 5.5% | 5.7% |
| Crude Goods | -3.0% | 1.2% | 13.2% | 1.4% | 14.6% | 17.5% |
| Core | 1.3% | 0.0% | 13.8% | 20.9% | 4.9% | 26.5% |

Tom Moeller
AuthorMore in Author Profile »Prior to joining Haver Analytics in 2000, Mr. Moeller worked as the Economist at Chancellor Capital Management from 1985 to 1999. There, he developed comprehensive economic forecasts and interpreted economic data for equity and fixed income portfolio managers. Also at Chancellor, Mr. Moeller worked as an equity analyst and was responsible for researching and rating companies in the economically sensitive automobile and housing industries for investment in Chancellor’s equity portfolio. Prior to joining Chancellor, Mr. Moeller was an Economist at Citibank from 1979 to 1984. He also analyzed pricing behavior in the metals industry for the Council on Wage and Price Stability in Washington, D.C. In 1999, Mr. Moeller received the award for most accurate forecast from the Forecasters' Club of New York. From 1990 to 1992 he was President of the New York Association for Business Economists. Mr. Moeller earned an M.B.A. in Finance from Fordham University, where he graduated in 1987. He holds a Bachelor of Arts in Economics from George Washington University.
More Economy in Brief


