 Global| Oct 20 2009
U.S. PPI Declines With Lower Energy, Food And Core Prices
by:Tom Moeller
|in:Economy in Brief
Summary
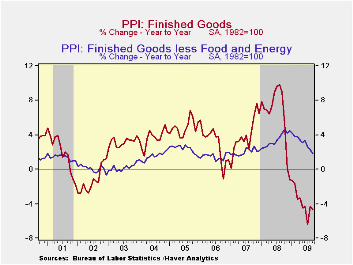
Pricing power virtually evaporated last month with across-the-board declines in goods prices. The PPI for finished goods fell 0.6%. It was the second decline in the last three months and left prices down 4.7% from the year-ago level. [...]
 Pricing
power virtually evaporated last month with across-the-board declines in
goods prices. The PPI for finished goods fell 0.6%. It was the second
decline in the last three months and left prices down 4.7% from the
year-ago level. The decline compared to the Consensus expectation for
no change. Moreover, it was broad-based and included lower food
& energy prices as well as the third decline in core prices in
the last five months. The 0.1% decline in the PPI less food &
energy contrasted with expectations for a 0.1% increase and it pulled
the y/y change to 1.8%, the weakest since May 2007.
Pricing
power virtually evaporated last month with across-the-board declines in
goods prices. The PPI for finished goods fell 0.6%. It was the second
decline in the last three months and left prices down 4.7% from the
year-ago level. The decline compared to the Consensus expectation for
no change. Moreover, it was broad-based and included lower food
& energy prices as well as the third decline in core prices in
the last five months. The 0.1% decline in the PPI less food &
energy contrasted with expectations for a 0.1% increase and it pulled
the y/y change to 1.8%, the weakest since May 2007.
 Lower
finished energy prices led the decline in last month's PPI with a 2.4%
drop (-22.2% y/y). Though the decline has been partially reversed here
in October, last month it reflected a 5.4% fall in gasoline prices
(-37.5% y/y). Natural gas prices also fell by 1.9% (-24.5% y/y) and
fuel oil prices fell 24.1% (-40.5% y/y).
Lower
finished energy prices led the decline in last month's PPI with a 2.4%
drop (-22.2% y/y). Though the decline has been partially reversed here
in October, last month it reflected a 5.4% fall in gasoline prices
(-37.5% y/y). Natural gas prices also fell by 1.9% (-24.5% y/y) and
fuel oil prices fell 24.1% (-40.5% y/y).
The PPI for finished consumer goods less food & energy slipped 0.1% but gained 2.2% y/y. That was the weakest annual increase since June 2007. Finished durables prices slipped 0.2% (+2.0% y/y) and prices of core finished consumer nondurable goods slipped for the fourth month in the last six. The 2.3% y/y increase was down from 5.9% as of last November. Capital equipment prices also reflected economic weakness and slipped 0.1%. That pulled the y/y increase down to 1.4% after a 4.3% rise as of last December.
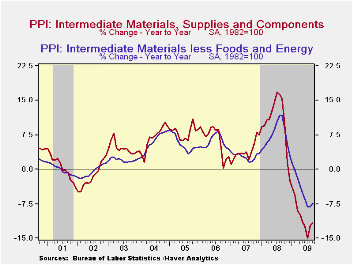
 Prices for intermediate goods inched 0.2%
higher, paced by a firm 0.9%
increase in core prices. They were led by a 1.3% (-11.3% y/y) increase
in prices for materials for manufacturing. Intermediate food prices
fell 0.5% (-12.9% y/y) and energy prices also slipped 2.1% (-24.2%
y/y).
Prices for intermediate goods inched 0.2%
higher, paced by a firm 0.9%
increase in core prices. They were led by a 1.3% (-11.3% y/y) increase
in prices for materials for manufacturing. Intermediate food prices
fell 0.5% (-12.9% y/y) and energy prices also slipped 2.1% (-24.2%
y/y).
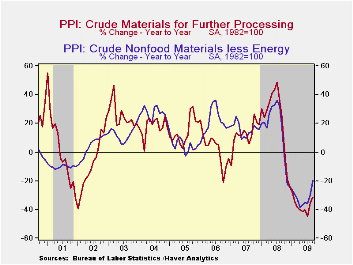
The crude materials PPI fell 2.1% and was led lower by a 5.4% decline (-42.6% y/y) in crude energy prices. In contrast, core prices showed strength and increased for the sixth straight month.
The producer price data is available in Haver's USECON database. More detailed data is in the PPI and in the PPIR databases.
| Producer Price Index (%) | September | August | Y/Y | 2008 | 2007 | 2006 |
|---|---|---|---|---|---|---|
| Finished Goods | -0.6 | 1.7 | -4.7 | 6.4 | 3.9 | 2.9 |
| Core | -0.1 | 0.2 | 1.8 | 3.4 | 2.0 | 1.5 |
| Intermediate Goods | 0.2 | 1.8 | -11.6 | 10.5 | 4.0 | 6.4 |
| Core | 0.9 | 0.6 | -7.5 | 7.4 | 2.8 | 6.0 |
| Crude Goods | -2.1 | 3.8 | -31.5 | 21.4 | 11.9 | 1.4 |
| Core | 3.6 | 6.0 | -19.6 | 14.8 | 15.6 | 20.8 |

Tom Moeller
AuthorMore in Author Profile »Prior to joining Haver Analytics in 2000, Mr. Moeller worked as the Economist at Chancellor Capital Management from 1985 to 1999. There, he developed comprehensive economic forecasts and interpreted economic data for equity and fixed income portfolio managers. Also at Chancellor, Mr. Moeller worked as an equity analyst and was responsible for researching and rating companies in the economically sensitive automobile and housing industries for investment in Chancellor’s equity portfolio. Prior to joining Chancellor, Mr. Moeller was an Economist at Citibank from 1979 to 1984. He also analyzed pricing behavior in the metals industry for the Council on Wage and Price Stability in Washington, D.C. In 1999, Mr. Moeller received the award for most accurate forecast from the Forecasters' Club of New York. From 1990 to 1992 he was President of the New York Association for Business Economists. Mr. Moeller earned an M.B.A. in Finance from Fordham University, where he graduated in 1987. He holds a Bachelor of Arts in Economics from George Washington University.
More Economy in Brief


