 Global| May 28 2010
U.S. Personal Spending Mixed& Income Firm
by:Tom Moeller
|in:Economy in Brief
Summary
Lower gasoline prices and a pause in auto purchases braked consumer spending last month. Personal consumption expenditures were unchanged during April after an unrevised 0.6% March gain. A 0.3% increase had been expected. Spending on [...]
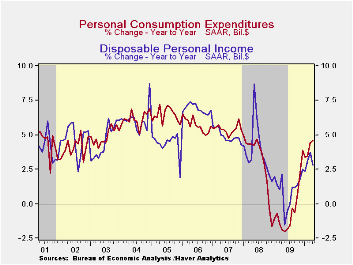
Lower gasoline prices and a pause in auto purchases braked
consumer spending last month. Personal consumption
expenditures were unchanged during April after an unrevised
0.6% March gain. A 0.3% increase had been expected. Spending on
gasoline slipped for the third straight month due to price declines.
The price influence is clear when observing that during the last year
nominal spending rose 35.9%; but in constant dollars, spending was
roughly unchanged. A large contribution from spending on autos also is
clear, but the trend is improved. Real spending fell 1.3% in April
after an 8.9% gain in March; but versus last year, spending on motor
vehicles has increased 11.3%.
Elsewhere, spending looked firm. April spending on home
furnishings rose 1.4% (7.4% y/y) for the third such monthly increase.
Even after allowing for higher prices, real spending was up 1.8% y/y
following the 5.9% decline during 2009. Apparel spending took a
breather, falling 0.8% last month after gains between 1.7% and 2.1%
during March & February. More impressive was that spending rose
5.7% y/y after the 3.5% decline last year. Adjusting for lower prices
spending jumped 6.8% y/y after falling 4.3% in 2009. Spending on
services continued firm at 2.8% y/y following last year's 1.6%
increase. The gain still was bloated by the 4.3% y/y jump in health
care expenditures but spending on financial services (4.3% y/y),
restaurants & accommodations (2.8% y/y) and recreation (0.8%
y/y) each was greatly improved.
Last month an expected 0.4% gain in personal income
accompanied the spending numbers. April disposable income rose an even
firmer 0.5% (2.8% y/y). Year-to-year, both are much improved versus
2009 but tax cuts have fueled take-home pay more. Higher gasoline
prices also cut into income growth. The 0.9% y/y gain in real
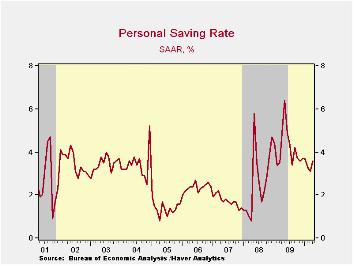
disposable income just equaled last year's increase. The outgrowth of
spending gains that exceeded income growth during the last twelve
months lowered the personal savings rate to 3.6%
from its high of 6.4% when the tax cuts were enacted. The latest rate
still was up, however, from the 1.0% low at the beginning of the last
recession.
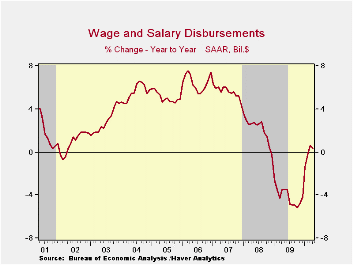
Employment declines left wages & salaries up just 0.3%
y/y, though that followed a sharp 4.1% decline last year. Wages in the
factory sector, however, rose a firmer 0.7% in April (-3.4% y/y) and
compared to last year's 11.3% shortfall. In the private service sector,
wages increased 0.8% y/y after last year's 4.0% decline. Improvement in
the housing market pulled proprietors' income up 5.4% y/y, its
strongest gain since early 2006 while the stabilization of interest
rates left interest income up 0.3% y/y following last year's 5.3%
decline. Dividend income remained down 1.6% y/y but that compared
favorably to last year's 19.3% drop and the 10.3% 2008 decline.
Finally, gains in unemployment insurance benefits (13.1% y/y) have
tapered off with the improved labor market.
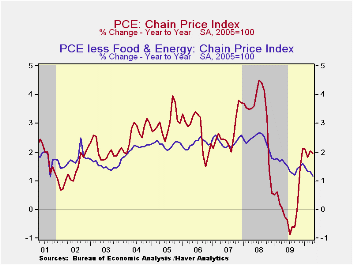
The PCE chain price index was unchanged
with the 2.3% slip (+38.1% y/y) in gasoline prices. The core PCE price
deflator ticked up 0.1%, held back by a 0.9% decline (-1.0% y/y) in
apparel prices and a 0.4% decline (-4.3% y/y) in furniture &
appliance prices. Services prices also gained 0.2% (1.7% y/y), while
health care prices rose 0.3% (2.6% y/y).
The personal income & consumption figures are available in Haver's USECON and USNA databases.
| Disposition of Personal Income (%) | April | March | February | Y/Y | 2009 | 2008 | 2007 |
|---|---|---|---|---|---|---|---|
| Personal Income | 0.4 | 0.4 | 0.0 | 2.5 | -1.8 | 2.9 | 5.6 |
| Disposable Personal Income | 0.5 | 0.4 | 0.0 | 2.8 | 1.0 | 3.9 | 4.9 |
| Personal Consumption Expenditures | 0.0 | 0.6 | 0.5 | 4.6 | -0.4 | 3.1 | 5.4 |
| Saving Rate | 3.6 | 3.1 | 3.3 | 4.9 (April '09) | 4.2 | 2.6 | 1.7 |
| PCE Chain Price Index | 0.0 | 0.1 | 0.0 | 2.0 | 0.2 | 3.3 | 2.7 |
| Less food & energy | 0.1 | 0.1 | 0.0 | 1.2 | 1.5 | 2.4 | 2.4 |
by Robert Brusca May 28, 2010
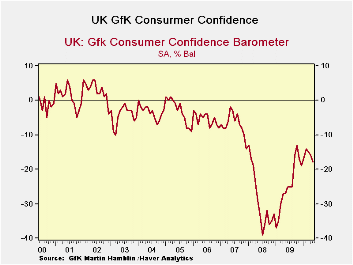
According to the Nationwide Building Society’s measure, U.K. consumer confidence fell in March by the most since July 2008 as the election due within weeks fueled Britons’ doubts about the economy. Small surprise that is: so much for politicians shoring up a feeling of hope and security. Increasingly elections are about making the opponent seem worse than you are. The consumer confidence polls seem to have picked up on this, with the obvious consequences. The index of sentiment fell 9 points from February to 72, erasing the gains in confidence seen so far this year. A gauge measuring expectations for the economy in the next six months fell 11 points to 105.This fall disappointed as the market consensus level was a reading of 81.
We contrast this result with the GfK survey above. It seems to show less of hit from the electioneering effect but it does demonstrate some backsliding in the assessment of the economy; plenty of raw nerves here for the politicians to tap into. The household financial situation eroded in March as did people’s assessment of their savings. Both lower and higher income respondents saw a worsening.
Looking ahead, fears of unemployment have been rising. The general economic situation is seen as poorer and households expect their financial situation to deteriorate further. There are increased concerns about savings adequacy and growing concerns about inflation.
With this as a back-drop there is plenty of fodder for election politicking to push all the consumers’ buttons. This appears to be in train. Still consumer confidence in the GfK measure is in the 92nd percentile of its two-year range showing considerable progress has been made, but that compares to a standing of just 60% in its 10_year range which emphasizes a bit more how far there is to go. Clearly the UK consumer remains challenged and will find his and her senses assaulted in this election season. May the least worse man win.
| GFK Consumer Survey | ||||||
|---|---|---|---|---|---|---|
| Of 2Yr | Of 10Yr | |||||
| May-10 | Apr-10 | Mar-10 | Feb-10 | Range | Range | |
| Consumer Confidence | -18 | -16 | -15 | -14 | 80.8% | 55.3% |
| Current | ||||||
| Household Fin Sit | 16 | 17 | 18 | 18 | 25.0% | 18.2% |
| Major Purchases | -21 | -20 | -17 | -16 | 71.0% | 36.7% |
| Last 12 Months | ||||||
| Household Fin Sit | -13 | -14 | -15 | -13 | 43.8% | 29.2% |
| General Econ Sit | -45 | -47 | -49 | -50 | 94.9% | 53.6% |
| CPI | 72 | 79 | 72 | 63 | 26.9% | 40.6% |
| Savings | -5 | -7 | -13 | -6 | 37.7% | 29.9% |
| Next 12-Months | ||||||
| Household Fin Sit | -3 | 2 | 4 | 6 | 62.5% | 46.9% |
| General Econ Sit | -9 | -1 | 0 | 4 | 76.8% | 76.8% |
| Unemployment | 36 | 33 | 36 | 31 | 11.1% | 27.3% |
| Major Purchases | -26 | -27 | -28 | -31 | 82.4% | 56.0% |
| Savings | 2 | 1 | 5 | 7 | 29.4% | 19.2% |
| CPI | 71 | 67 | 63 | 60 | 60.8% | 60.8% |
| By Income | ||||||
| Lower | -24 | -22 | -21 | -18 | 77.8% | 50.0% |
| Upper | -11 | -8 | -5 | -3 | 72.4% | 55.3% |
by Tom Moeller May 28,2010
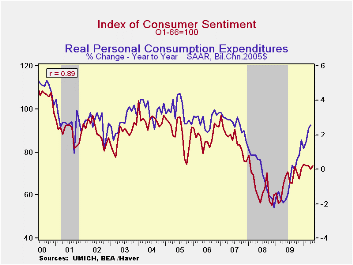
Consumers' mood has improved, but lately not by much. The University of Michigan reported that its May reading of consumer sentiment rose to 73.6 from 72.2 during April. The slight m/m increase characterizes sentiment's performance during 2010. The figure has moved sideways following sharp improvement during 2009. The latest figure was as expected. During the last ten years there has been an 89% correlation between the level of sentiment and the y/y change in real consumer spending.
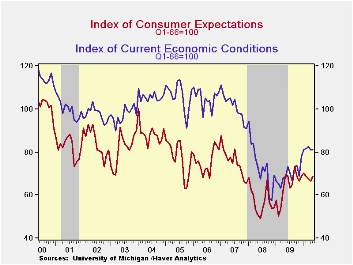
The index of expected economic conditions improved m/m to 68.8. Here again, the figure has moved sideways of late but is more than one-third above the recession low. The readings for expected change in personal finances (-3.5% y/y), business conditions during the next twelve months (10.7% y/y) and expected five-year business conditions (-6.8% y/y) each recently have been flat-to-lower.
Sentiment about current economic conditions recently moved sideways, as well. Nevertheless, it remained up 19.6% from last year and by nearly one-half from the 2008 low. The assessment of current personal finances rose nearly one-third versus last year but buying conditions for large household goods, including furniture, refrigerators, stoves & televisions, recently slipped (+16.8% y/y).
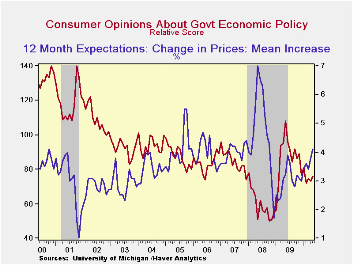
Expected price inflation during the next year increased to 4.1% and was up from the December 2008 reading of 1.7%.Respondents' view of government policy, which may eventually influence economic expectations, nudged up m/m but was down nearly one-third from its high last May. Thirteen percent of respondents thought that a good job was being done by government versus 37% who thought a poor job was being done, near the twelve-month high.
| University of Michigan | May | Mid-May | April | March | May y/y | 2009 | 2008 | 2007 |
|---|---|---|---|---|---|---|---|---|
| Consumer Sentiment | 73.6 | 73.3 | 72.2 | 73.6 | 7.1% | 66.3 | 63.8 | 85.6 |
| Current Conditions | 81.0 | 81.1 | 81.0 | 82.4 | 19.6 | 69.6 | 73.7 | 101.2 |
| Expectations | 68.8 | 68.3 | 66.5 | 67.9 | -0.9 | 64.1 | 57.3 | 75.6 |

Tom Moeller
AuthorMore in Author Profile »Prior to joining Haver Analytics in 2000, Mr. Moeller worked as the Economist at Chancellor Capital Management from 1985 to 1999. There, he developed comprehensive economic forecasts and interpreted economic data for equity and fixed income portfolio managers. Also at Chancellor, Mr. Moeller worked as an equity analyst and was responsible for researching and rating companies in the economically sensitive automobile and housing industries for investment in Chancellor’s equity portfolio. Prior to joining Chancellor, Mr. Moeller was an Economist at Citibank from 1979 to 1984. He also analyzed pricing behavior in the metals industry for the Council on Wage and Price Stability in Washington, D.C. In 1999, Mr. Moeller received the award for most accurate forecast from the Forecasters' Club of New York. From 1990 to 1992 he was President of the New York Association for Business Economists. Mr. Moeller earned an M.B.A. in Finance from Fordham University, where he graduated in 1987. He holds a Bachelor of Arts in Economics from George Washington University.
More Economy in Brief


