 Global| Aug 30 2010
U.S. Personal Spending Firms As Consumers Dip Into Savings
by:Tom Moeller
|in:Economy in Brief
Summary
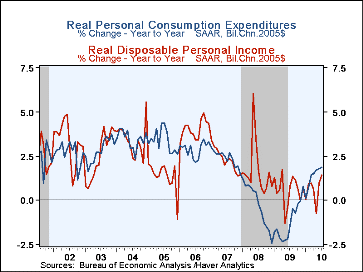
One way or another, U.S. consumers know how to do what they're paid to do. Personal consumption during July increased a firm 0.4% following an unrevised dip during June. The increase beat Consensus expectations for a 0.3% gain. Though [...]
 One way or another, U.S. consumers know how to do what they're paid to do. Personal
consumption during July increased a firm 0.4% following an
unrevised dip during June. The increase beat Consensus expectations for a 0.3%
gain. Though the monthly gain in constant dollars amounted to a lesser 0.2% with
the rise in gasoline prices, real spending advanced at a 2.1% annual growth rate
during the last three months. Most of that firmness owes to gains in services
spending, notably housing & utilities (7.1%), "other" (4.3%),
transportation (3.3%) and health care (2.7%). For goods, real spending growth
eased due to declines in spending on home furnishings (-3.3%) and apparel
(-9.9%).
On the income side of the ledger growth remained moderate, posting a 0.2% July increase following little-change during June. The gain fell short of expectations for a 0.3% rise. Allowing for taxes and prices, nominal disposable income rose 0.2% last month and 3.0% y/y. Wage and salary growth was an improved, though modest 1.7% y/y, and proprietors' income rose 4.4%. Income from stocks & bonds was, however, little-changed. In real terms, disposable personal income rose 0.2% (3.0% y/y).
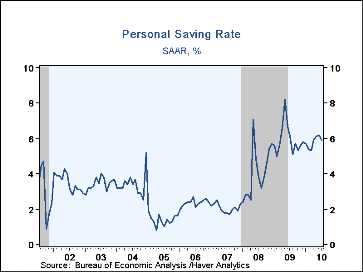
The personal savings rate fell to 5.9% due to this moderate-spending but modest-income combination, though the decline was slight from the 2Q rate of 6.1%. The latest equals the level for all of last year and remains up from the 1.8% low during the fall of 2007.
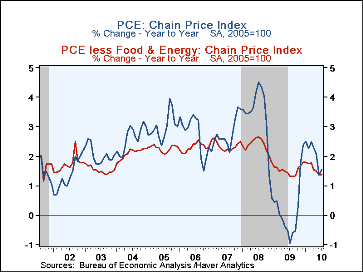
The PCE chain price index gained a moderate 0.2% though it beat expectations for a 0.1% uptick. A 4.4% increase (7.7% y/y) in gasoline prices reversed all of the June decline. Food & beverage prices were unchanged (0.7% y/y) but that's up from declines early this year. The core PCE price deflator ticked up just 0.1% and y/y growth fell to 1.4%, near its weakest since the 1960s.
The personal income & consumption figures are available in Haver's USECON and USNA databases
The Fed's Exit Strategy for Monetary Policy from the Federal Reserve Bank of San Francisco can be found here.
| Disposition of Personal Income (%) | July | June | May | Y/Y | 2009 | 2008 | 2007 |
|---|---|---|---|---|---|---|---|
| Personal Income | 0.2 | -0.0 | 0.3 | 3.0 | -1.7 | 4.0 | 5.7 |
| Wage & Salaries | 0.3 | -0.1 | 0.4 | 1.7 | -4.3 | 2.1 | 5.8 |
| Disposable Personal Income | 0.2 | -0.0 | 0.3 | 3.0 | 0.7 | 5.1 | 5.1 |
| Personal Consumption Expenditures | 0.4 | -0.0 | 0.1 | 3.4 | -1.0 | 3.0 | 5.2 |
| Saving Rate | 5.9 | 6.2 | 6.1 | 6.1(July '09) | 5.9 | 4.1 | 2.1 |
| PCE Chain Price Index | 0.2 | -0.1 | -0.1 | 1.5 | 0.2 | 3.3 | 2.7 |
| Less food & energy | 0.1 | 0.0 | 0.1 | 1.4 | 1.5 | 2.3 | 2.4 |
Tom Moeller
AuthorMore in Author Profile »Prior to joining Haver Analytics in 2000, Mr. Moeller worked as the Economist at Chancellor Capital Management from 1985 to 1999. There, he developed comprehensive economic forecasts and interpreted economic data for equity and fixed income portfolio managers. Also at Chancellor, Mr. Moeller worked as an equity analyst and was responsible for researching and rating companies in the economically sensitive automobile and housing industries for investment in Chancellor’s equity portfolio. Prior to joining Chancellor, Mr. Moeller was an Economist at Citibank from 1979 to 1984. He also analyzed pricing behavior in the metals industry for the Council on Wage and Price Stability in Washington, D.C. In 1999, Mr. Moeller received the award for most accurate forecast from the Forecasters' Club of New York. From 1990 to 1992 he was President of the New York Association for Business Economists. Mr. Moeller earned an M.B.A. in Finance from Fordham University, where he graduated in 1987. He holds a Bachelor of Arts in Economics from George Washington University.
More Economy in Brief
 Global| Feb 05 2026
Charts of the Week: Balanced Policy, Resilient Data and AI Narratives
by:Andrew Cates


