 Global| May 28 2004
U.S. Personal Income Up More Than Expected
by:Tom Moeller
|in:Economy in Brief
Summary
Personal income rose 0.6% (+5.7% y/y) last month versus the Consensus expectation for a 0.5% gain. While the upside surprise was slight, it reflected a firm 0.5% (4.8% y/y) rise in wages & salaries that followed an upwardly revised [...]
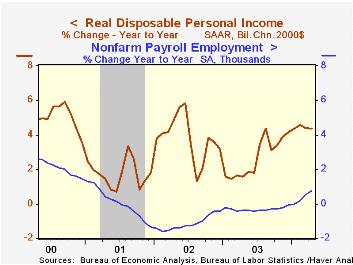
Personal income rose 0.6% (+5.7% y/y) last month versus the Consensus expectation for a 0.5% gain.
While the upside surprise was slight, it reflected a firm 0.5% (4.8% y/y) rise in wages & salaries that followed an upwardly revised 0.3% March increase. Firm wage gains were logged across industries.
Personal disposable income increased 0.5% following a 0.4% March increase. The 6.3% y/y increase in disposable income was the strongest since June 2002. After accounting for a 1.9% rise in prices, real disposable income rose 4.3%.
Consumer spending rose a modest 0.3% in April, held back by a 1.6% m/m decline unit light vehicle sales. A 0.2% gain in PCE had been expected.
The PCE chain price index rose just 0.1%. Less food & energy, prices rose 0.1% (1.4% y/y) following a 0.2% March gain.
The savings rate moved higher to 2.4%, the highest level since last Summer.
| Disposition of Personal Income | April | Mar | Y/Y | 2003 | 2002 | 2001 |
|---|---|---|---|---|---|---|
| Personal Income | 0.6% | 0.4% | 5.7% | 3.3% | 2.3% | 3.4% |
| Personal Consumption | 0.3% | 0.5% | 6.5% | 5.0% | 4.8% | 4.5% |
| Savings Rate | 2.4% | 2.2% | 2.4% | 2.1% | 2.3% | 1.7% |
| PCE Chain Price Index | 0.1% | 0.3% | 1.9% | 1.8% | 1.4% | 2.0% |
by Tom Moeller May 28, 2004
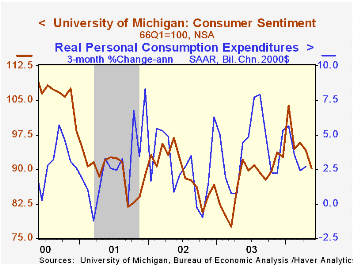
The University of Michigan’s consumer sentiment index for the full month of May fell to90.2 from 94.2 in April. The reading reflected deterioration late in the month versus a mid-month reading of 94.2. Consensus expectations had been for a slight rise to 95.0.
During the last ten years there has been a 75% correlation between the level of consumer sentiment and the y/y change in real PCE. That correlation has risen to 82% during the last five years.
Perceptions of current economic conditions fell 1.3% following the 1.7% decline in April. The expectations index dropped a sharp 6.5% m/m and added to a 1.7% April dip. Both readings were down from mid-month.
The decline in Sentiment in May contrasted with the very slight rise in Consumer Confidence reported earlier by the Conference Board. During the last ten years there has been an 84% correlation between the y/y change in the two measures.
The University of Michigan survey is not seasonally adjusted.The mid-month survey is based on telephone interviews with 250 households nationwide on personal finances and business and buying conditions. The survey is expanded to a total of 500 interviews at month end.
| University of Michigan | May | April | Y/Y | 2003 | 2002 | 2001 |
|---|---|---|---|---|---|---|
| Consumer Sentiment | 90.2 | 94.2 | -2.1% | 87.6 | 89.6 | 89.2 |
| Current Conditions | 103.6 | 105.0 | 11.2% | 97.2 | 97.5 | 100.1 |
| Consumer Expectations | 81.6 | 87.3 | -10.7% | 81.4 | 84.6 | 82.3 |
by Tom Moeller May 28, 2004
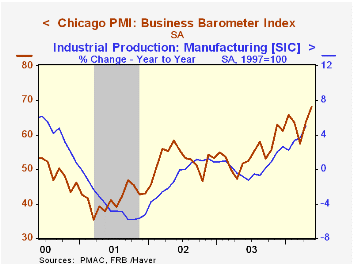
The Chicago Purchasing Managers Business Barometer for May rose to 68.0 from 63.9 in April. The rise reflected strength versus Consensus expectations for a slight decline to 62.5 and was to the highest level since July 1988.
During the last ten years there has been an 83% correlation between the level of the Chicago Business Barometer and quarterly growth in factory sector industrial output. There has been a 48% correlation with growth in real GDP.
The new orders index led the increase to 74.4, the highest level since 1988. Production also rose a hefty 6.3 points to 71.1 and moved closer to the January high of 76.5.
Employment surged 3.9 points to 54.8, the current cycle high. During the last twenty years there has been a 71% correlation between the level of this employment index and the y/y change in factory sector payroll employment.
The index of prices paid jumped to 80.0, the highest since February 1995.
| Chicago Purchasing Managers Index, SA | May | April | May '03 | 2003 | 2002 | 2001 |
|---|---|---|---|---|---|---|
| Business Barometer | 68.0 | 63.9 | 51.6 | 54.7 | 52.7 | 41.4 |
| New Orders | 74.4 | 65.1 | 54.5 | 58.0 | 56.2 | 42.3 |
| Prices Paid | 80.0 | 76.1 | 52.6 | 55.8 | 56.9 | 50.4 |

Tom Moeller
AuthorMore in Author Profile »Prior to joining Haver Analytics in 2000, Mr. Moeller worked as the Economist at Chancellor Capital Management from 1985 to 1999. There, he developed comprehensive economic forecasts and interpreted economic data for equity and fixed income portfolio managers. Also at Chancellor, Mr. Moeller worked as an equity analyst and was responsible for researching and rating companies in the economically sensitive automobile and housing industries for investment in Chancellor’s equity portfolio. Prior to joining Chancellor, Mr. Moeller was an Economist at Citibank from 1979 to 1984. He also analyzed pricing behavior in the metals industry for the Council on Wage and Price Stability in Washington, D.C. In 1999, Mr. Moeller received the award for most accurate forecast from the Forecasters' Club of New York. From 1990 to 1992 he was President of the New York Association for Business Economists. Mr. Moeller earned an M.B.A. in Finance from Fordham University, where he graduated in 1987. He holds a Bachelor of Arts in Economics from George Washington University.
More Economy in Brief


