 Global| Apr 30 2004
U.S. Personal Income & Spending Rose Moderately
by:Tom Moeller
|in:Economy in Brief
Summary
Personal income rose 0.4% (+4.9% y/y) last month following an upwardly revised 0.5% gain in February. Consensus expectations had been for a 0.4% rise. Wage & salary growth cooled to 0.2% (+3.7% y/y) after 0.5% and 0.7% gains in the [...]
Personal income rose 0.4% (+4.9% y/y) last month following an upwardly revised 0.5% gain in February. Consensus expectations had been for a 0.4% rise.
Wage & salary growth cooled to 0.2% (+3.7% y/y) after 0.5% and 0.7% gains in the prior two months. A modest decline in manufacturing wages (1.8% y/y) was accompanied by a slower 0.2% (4.4% y/y) rise in service industry wages.
Personal disposable income rose 0.4% (5.7% y/y) following a 0.5% February increase. Tax payments rose 0.4% (-1.1% y/y).
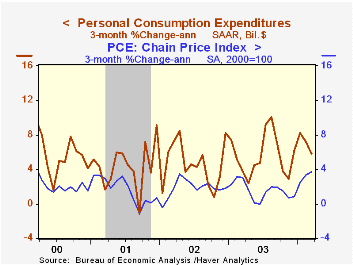
Consumer spending rose the same 0.4% in March as during the month prior. A 0.7% gain in PCE had been the Consensus expectation. Services PCE slowed to a modest 0.2% (5.5% y/y) versus 0.4% and 0.8% gains in the prior two months. Durable spending rose 0.4% (6.0% y/y) as unit light vehicle sales rose 1.7% (2.9% y/y).
The PCE chain price index rose 0.3%. Less food & energy prices rose 0.2% (1.4% y/y) in March. Since October monthly increases in the core PCE price index have been either 0.1% or 0.2%.
The savings rate held steady at 1.9%.
| Disposition of Personal Income | Mar | Feb | Y/Y | 2003 | 2002 | 2001 |
|---|---|---|---|---|---|---|
| Personal Income | 0.4% | 0.5% | 4.9% | 3.3% | 2.3% | 3.4% |
| Personal Consumption | 0.4% | 0.4% | 5.9% | 5.0% | 4.8% | 4.5% |
| Savings Rate | 1.9% | 1.9% | 2.0% | 2.1% | 2.3% | 1.7% |
| PCE Chain Price Index | 0.3% | 0.2% | 1.6% | 1.8% | 1.4% | 2.0% |
by Tom Moeller April 30, 2004
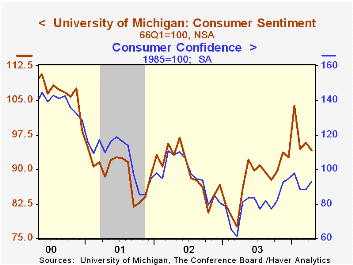
The University of Michigan’s consumer sentiment index for the full month of April fell to 94.2 from 95.8 in March. The reading about equaled Consensus expectations and represented an improvement from the mid-month reading of 93.2.
During the last ten years there has been a 75% correlation between the level of consumer sentiment and the y/y change in real PCE. That correlation has risen to 82% during the last five years.
Perceptions of current economic conditions slipped 1.7% in April to 105.0. The expectations index fell 1.7% to 87.3. Both figures were slightly improved from the mid-month readings.
The figures contrasted with the moderate improvement in Consumer Confidence in April reported earlier by the Conference Board. During the last ten years there has been an 84% correlation between the y/y change in the two measures.
The University of Michigan survey is not seasonally adjusted.The mid-month survey is based on telephone interviews with 250 households nationwide on personal finances and business and buying conditions. The survey is expanded to a total of 500 interviews at month end.
| University of Michigan | April | Mar | Y/Y | 2003 | 2002 | 2001 |
|---|---|---|---|---|---|---|
| Consumer Sentiment | 94.2 | 95.8 | 9.5% | 87.6 | 89.6 | 89.2 |
| Current Conditions | 105.0 | 106.8 | 8.9% | 97.2 | 97.5 | 100.1 |
| Consumer Expectations | 87.3 | 88.8 | 10.1% | 81.4 | 84.6 | 82.3 |
by Tom Moeller April 30, 2004
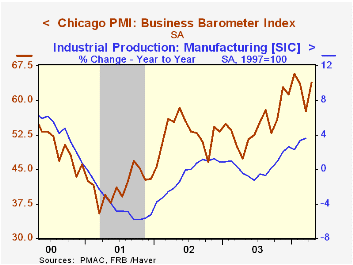
The April Chicago Purchasing Managers Business Barometer rose to 63.9 from 57.6 in March. The increase beat Consensus expectations for a gain to 61.0 and was to a level just short of the ten year high in January.
During the last ten years there has been an 83% correlation between the level of the Chicago Business Barometer and quarterly growth in factory sector industrial output. There has been a 48% correlation with growth in real GDP.
The new orders index jumped to 65.1 from 60.4, recovering much of the 7.1 point drop in March. Production rose 5.7 points to 64.8 but this index still is well off the January high of 76.5.
Employment improved modestly to 50.9 versus 49.2 in March and versus 50.8 in 1Q. During the last twenty years there has been a 71% correlation between the level of this employment index and the y/y change in factory sector payroll employment.
The index of prices paid was again firm and rose to 76.1.
| Chicago Purchasing Managers Index, SA | April | Mar | April '03 | 2003 | 2002 | 2001 |
|---|---|---|---|---|---|---|
| Business Barometer | 63.9 | 57.6 | 47.3 | 54.7 | 52.7 | 41.4 |
| New Orders | 65.1 | 60.4 | 44.0 | 58.0 | 56.2 | 42.3 |
| Prices Paid | 76.1 | 75.7 | 54.9 | 55.8 | 56.9 | 50.4 |

Tom Moeller
AuthorMore in Author Profile »Prior to joining Haver Analytics in 2000, Mr. Moeller worked as the Economist at Chancellor Capital Management from 1985 to 1999. There, he developed comprehensive economic forecasts and interpreted economic data for equity and fixed income portfolio managers. Also at Chancellor, Mr. Moeller worked as an equity analyst and was responsible for researching and rating companies in the economically sensitive automobile and housing industries for investment in Chancellor’s equity portfolio. Prior to joining Chancellor, Mr. Moeller was an Economist at Citibank from 1979 to 1984. He also analyzed pricing behavior in the metals industry for the Council on Wage and Price Stability in Washington, D.C. In 1999, Mr. Moeller received the award for most accurate forecast from the Forecasters' Club of New York. From 1990 to 1992 he was President of the New York Association for Business Economists. Mr. Moeller earned an M.B.A. in Finance from Fordham University, where he graduated in 1987. He holds a Bachelor of Arts in Economics from George Washington University.
More Economy in Brief


