 Global| Feb 02 2004
U.S. Personal Income Growth Moderate
by:Tom Moeller
|in:Economy in Brief
Summary
Personal income rose an expected 0.2% (+3.8% y/y) in December, just under the average gain during the last five months. Personal disposable income also rose 0.2% (4.7% y/y), but that was an acceleration from the average five-month [...]
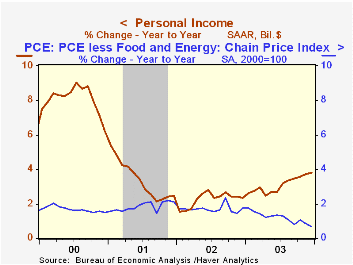
Personal income rose an expected 0.2% (+3.8% y/y) in December, just under the average gain during the last five months. Personal disposable income also rose 0.2% (4.7% y/y), but that was an acceleration from the average five-month gain.
Wages & salaries fell 0.3% (+2.4% y/y), dragged lower by the shorter workweek indicated in the December employment report.
A 0.9% (8.4% y/y) gain proprietors' income, a 5.4% (24.5% y/y) surge in rental income and a 0.8% (6.2% y/y) jump in transfer receipts fueled recent gains in total personal income.
Consumer spending jumped 0.4%, driven by a 1.8% gain in durable goods spending. Sales of light vehicles rose 4.4% m/m to 17.68M units following a 6.4% November jump. Spending on nondurables were unchanged (6.4% y/y). The price deflator for nondurables rose 0.2% despite lower gasoline prices in December. Services spending rose 0.4% (4.2% y/y).
The PCE price deflator rose 0.2%. Less food and energy prices rose 0.2% in December, but the full year gain of 1.2% was the slowest since 1965.
The savings rate dropped to 1.3%, the low end of the range of the last two years.
| Disposition of Personal Income | Dec | Nov | Y/Y | 2003 | 2002 | 2001 |
|---|---|---|---|---|---|---|
| Personal Income | 0.2% | 0.3% | 3.8% | 3.1% | 2.3% | 3.4% |
| Personal Consumption | 0.4% | 0.5% | 4.9% | 5.0% | 4.8% | 4.5% |
| Savings Rate | 1.3% | 1.5% | 1.3% | 2.0% | 2.3% | 1.7% |
| PCE Price Deflator | 0.2% | -0.1% | 1.3% | 1.8% | 1.4% | 2.0% |
by Tom Moeller February 2, 2004
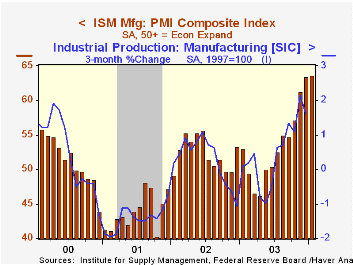
The Purchasing Managers’ Composite Index (PMI) released by the Institute of Supply Management inched up to 63.6 in January. That was versus a December level of 63.4, revised down (due to new seasonal factors) from the initial reading of 66.2. Consensus expectations were for a reading of 64.0.
During the last twenty years there has been a 72% correlation between the level of the PMI index and the three month growth in factory sector industrial production. There has been a 58% correlation between the level of the PMI Composite Index and quarterly growth in real GDP.
The new orders index fell to 71.1 from a 73.1. Though the December level was revised down, these levels are near the series' record high. The production index rose to 71.1, the highest level since December 1983.
The employment index fell modestly to 52.9 but remained above 50 for the third straight month. There has been a 71% correlation during the last ten years between the ISM employment index and the one-month change in factory sector payrolls.
The inventory index improved to 48.9, sharp improvement from the 2001-2002 lows below 40.
The prices paid index jumped to 75.5, the highest level since March 2000. There has been a 40% correlation between the prices paid index and the three month change in the finished goods PPI over the last ten years. The correlation with the intermediate materials PPI has been a higher 77%.
| ISM Manufacturing Survey | Jan | Dec | Jan '03 | 2003 | 2002 | 2001 |
|---|---|---|---|---|---|---|
| Composite Index | 63.6 | 63.4 | 53.0 | 53.3 | 52.4 | 43.9 |
| New Orders Index | 71.1 | 73.1 | 58.6 | 58.1 | 56.6 | 46.1 |
| Prices Paid Index (NSA) | 75.5 | 66.0 | 57.5 | 59.6 | 57.6 | 42.9 |
by Tom Moeller February 2, 2004
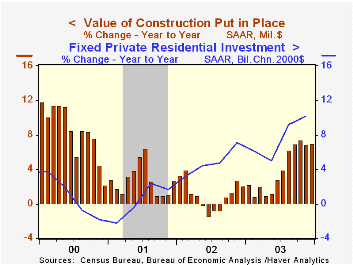
The value of total construction put in place rose 0.4% in December (7.0% y/y). November's previously reported 1.2% jump was revised down to 0.5% mostly due to lowered figures for public construction spending. A 0.8% rise was expected for December.
Private residential building activity added 0.9% (13.7% y/y) to the little revised 2.1% surge in November. Single family home building jumped another 1.5% (19.5% y/y).
Commercial construction fell for the fourth straight month (+4.0% y/y). Education spending jumped 4.0% (2.1% y/y). Office construction fell hard for the second month and November was revised down (-5.5% y/y).
These more detailed categories represent the Census Bureau’s reclassification of construction activity into end-use groups. Finer detail is available for many of the categories; for instance, commercial construction is shown for Automotive sales and parking facilities, drugstores, building supply stores, and both commercial warehouses and mini-storage facilities. Note that start dates vary for some seasonally adjusted line items in 2000 and 2002 and that constant-dollar data are no longer computed.
| Construction Put-in-place | Dec | Nov | Y/Y | 2003 | 2002 | 2001 |
|---|---|---|---|---|---|---|
| Total | 0.4% | 0.5% | 7.0% | 4.0% | 1.1% | 2.7% |
| Private | 0.3% | 0.7% | 8.2% | 4.5% | -0.2% | 1.4% |
| Residential | 0.9% | 2.1% | 13.7% | 10.2% | 8.6% | 3.3% |
| Nonresidential | -1.1% | -2.3% | -3.0% | -5.9% | -13.0% | -1.3% |
| Public | 0.6% | -0.3% | 3.2% | 2.6% | 5.3% | 7.4% |

Tom Moeller
AuthorMore in Author Profile »Prior to joining Haver Analytics in 2000, Mr. Moeller worked as the Economist at Chancellor Capital Management from 1985 to 1999. There, he developed comprehensive economic forecasts and interpreted economic data for equity and fixed income portfolio managers. Also at Chancellor, Mr. Moeller worked as an equity analyst and was responsible for researching and rating companies in the economically sensitive automobile and housing industries for investment in Chancellor’s equity portfolio. Prior to joining Chancellor, Mr. Moeller was an Economist at Citibank from 1979 to 1984. He also analyzed pricing behavior in the metals industry for the Council on Wage and Price Stability in Washington, D.C. In 1999, Mr. Moeller received the award for most accurate forecast from the Forecasters' Club of New York. From 1990 to 1992 he was President of the New York Association for Business Economists. Mr. Moeller earned an M.B.A. in Finance from Fordham University, where he graduated in 1987. He holds a Bachelor of Arts in Economics from George Washington University.
More Economy in Brief


