Global| Aug 30 2012
U.S. Personal Income Growth Is Steady; Spending Improves
by:Tom Moeller
|in:Economy in Brief
Summary
Personal income grew an expected 0.3% in July (3.6% y/y), the same as in the prior two months. June's rise was revised down from 0.5%. Wages and salaries increased 0.2% (3.5% y/y) after a 0.4% June rise. Earnings on financial assets [...]
 Personal income grew an expected 0.3% in July (3.6% y/y),
the same as in the prior two months. June's rise was revised down
from 0.5%. Wages and salaries increased 0.2% (3.5% y/y) after a 0.4%
June rise. Earnings on financial assets produced a 1.1% gain (8.3%
y/y) in dividend income but that offset a 0.5% decline (-0.4% y/y)
in interest earnings. Proprietors' income increased 0.5% (4.5% y/y).
A 0.2% rise in taxes (5.9% y/y) left disposable income up 0.3% (3.4%
y/y) for the third straight month. Inflation-adjusted take-home pay
increased 0.3% (2.0% y/y) following a downwardly revised 0.2% June
rise.
Personal income grew an expected 0.3% in July (3.6% y/y),
the same as in the prior two months. June's rise was revised down
from 0.5%. Wages and salaries increased 0.2% (3.5% y/y) after a 0.4%
June rise. Earnings on financial assets produced a 1.1% gain (8.3%
y/y) in dividend income but that offset a 0.5% decline (-0.4% y/y)
in interest earnings. Proprietors' income increased 0.5% (4.5% y/y).
A 0.2% rise in taxes (5.9% y/y) left disposable income up 0.3% (3.4%
y/y) for the third straight month. Inflation-adjusted take-home pay
increased 0.3% (2.0% y/y) following a downwardly revised 0.2% June
rise.
These moderate gains in income afforded individuals the opportunity to lift the personal savings rate to 4.2% last month and 4.3% in June. These figures are up from November's 3.2%, the highest since June of last year.
Personal consumption expenditures rebounded by an expected 0.4% after a little-revised no change in June. Adjusted for prices, spending also rose 0.4% (2.0% y/y). Real spending on durable goods jumped 1.1% (8.0% y/y) while inflation-adjusted outlays on nondurables gained 0.5% (1.1% y/y). Real services spending rose 0.3% (1.3% y/y).
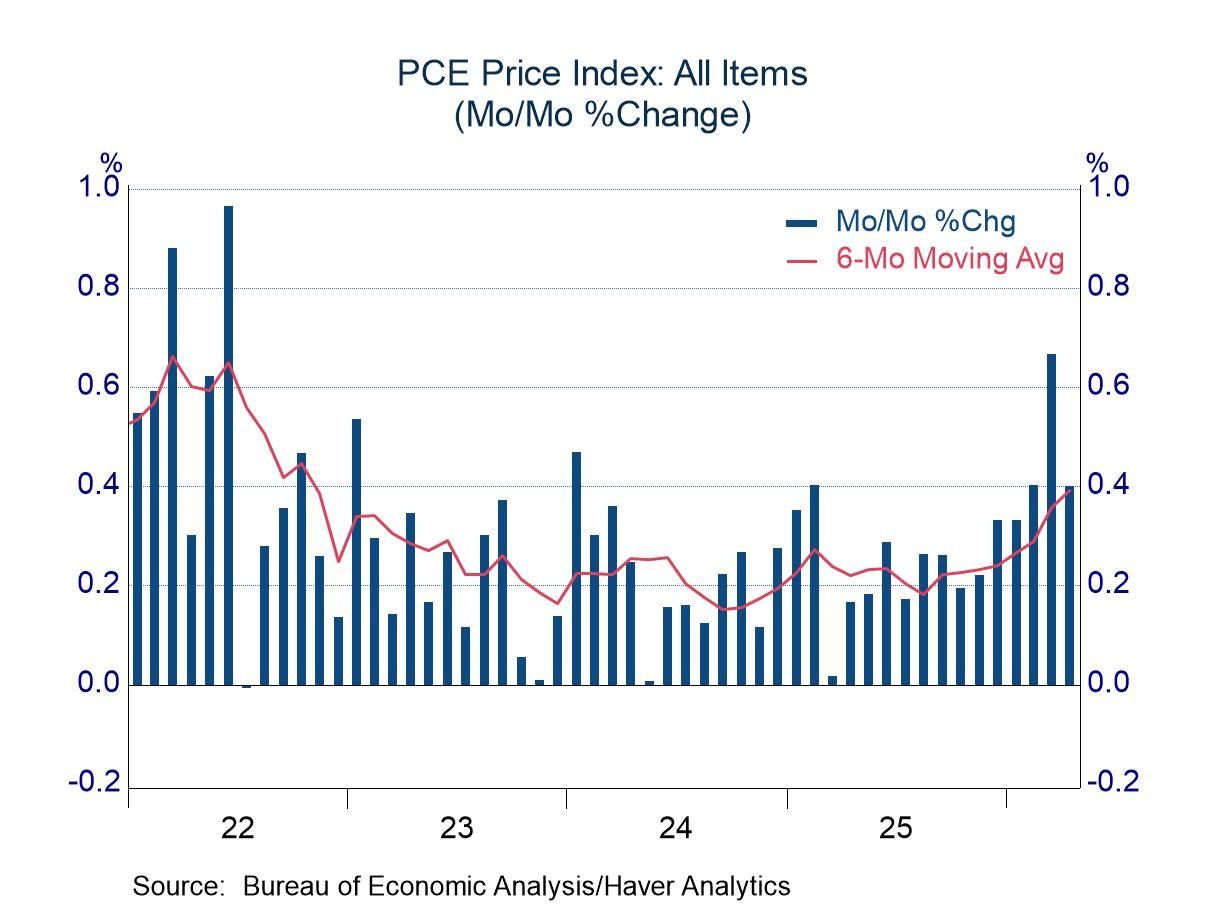
The PCE chain price index was unchanged (1.5% y/y) in July after June's 0.1% uptick. Durable goods prices fell 0.3% (-1.8% y/y), the fifth decline in six months. Nondurables costs increased 0.2% (1.0% y/y), helped by the rise in gasoline prices, and services prices were unchanged (1.9% y/y). Less food and energy, the PCE chain price index also was unchanged (1.6% y/y).
The personal income & consumption figures are available in Haver's USECON and USNA databases. The consensus expectations figures are in the AS1REPNA database.
The Federal Reserve's latest Beige Book covering regional economic conditions is available here.


| Personal Income & Outlays(%) | Jul | Jun | May | Y/Y | 2011 | 2010 | 2009 |
|---|---|---|---|---|---|---|---|
| Personal Income | 0.3 | 0.3 | 0.3 | 3.6 | 5.1 | 3.8 | -4.8 |
| Wages & Salaries | 0.2 | 0.4 | 0.1 | 3.5 | 4.0 | 2.1 | -4.3 |
| Disposable Personal Income | 0.3 | 0.3 | 0.3 | 3.4 | 3.8 | 3.8 | -2.7 |
| Personal Consumption Expenditures | 0.4 | 0.0 | -0.2 | 3.3 | 5.0 | 3.8 | -1.9 |
| Personal Saving Rate | 4.2 | 4.3 | 4.0 | 4.2 (Jul'11) |
4.2 | 5.1 | 4.7 |
| PCE Chain Price Index | 0.0 | 0.1 | -0.2 | 1.3 | 2.4 | 1.9 | 0.1 |
| Less Food & Energy | 0.0 | 0.2 | 0.1 | 1.6 | 1.4 | 1.5 | 1.4 |
| Real Disposable Income | 0.3 | 0.2 | 0.5 | 2.0 | 1.3 | 1.8 | -2.8 |
| Real Personal Consumption Expenditures |
0.4 | -0.1 | -0.0 | 2.0 | 2.5 | 1.8 | -1.9 |

Tom Moeller
AuthorMore in Author Profile »Prior to joining Haver Analytics in 2000, Mr. Moeller worked as the Economist at Chancellor Capital Management from 1985 to 1999. There, he developed comprehensive economic forecasts and interpreted economic data for equity and fixed income portfolio managers. Also at Chancellor, Mr. Moeller worked as an equity analyst and was responsible for researching and rating companies in the economically sensitive automobile and housing industries for investment in Chancellor’s equity portfolio. Prior to joining Chancellor, Mr. Moeller was an Economist at Citibank from 1979 to 1984. He also analyzed pricing behavior in the metals industry for the Council on Wage and Price Stability in Washington, D.C. In 1999, Mr. Moeller received the award for most accurate forecast from the Forecasters' Club of New York. From 1990 to 1992 he was President of the New York Association for Business Economists. Mr. Moeller earned an M.B.A. in Finance from Fordham University, where he graduated in 1987. He holds a Bachelor of Arts in Economics from George Washington University.
More Economy in Brief