 Global| Jun 30 2006
U.S. Personal Income Firm, Prices Tame
by:Tom Moeller
|in:Economy in Brief
Summary
Personal income rose 0.4% last month following an upwardly revised 0.5% gain during April. The May increase doubled Consensus expectations for a 0.2% rise. The PCE chain price index rose an expected 0.4% and reflected a 4.6% (30.5% [...]
Personal income rose 0.4% last month following an upwardly revised 0.5% gain during April. The May increase doubled Consensus expectations for a 0.2% rise.
The PCE chain price index rose an expected 0.4% and reflected a 4.6% (30.5% y/y) jump in gasoline & oil prices. Less food & energy the 0.2% (2.1% y/y) rise in the chain price index also was expected. Prices for clothing & shoes fell 0.1% (-0.6% y/y) and furniture & household equipment prices continued their long standing decline (-5.0% y/y).
A strong 1.2% (7.4% y/y) gain in personal interest income and a 0.9% (11.1% y/y) increase in dividend income paced last month's rise in income.
Wage & salary disbursements were unchanged (4.8% y/y) after a downwardly revised 0.8% spike during April. Private sector wages were unchanged (5.1% y/y) as factory sector wages fell 0.1% (+2.4% y/y). Service producing industries wages also fell 0.1% (+5.4% y/y) after a 1.1% April jump.
Government transfer payments for health insurance & disability surged 1.0% (12.1% y/y) reflecting Medicare drug coverage.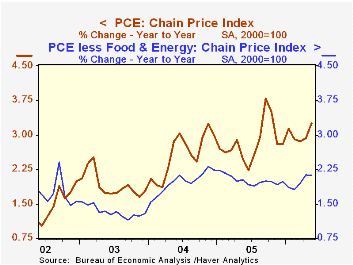
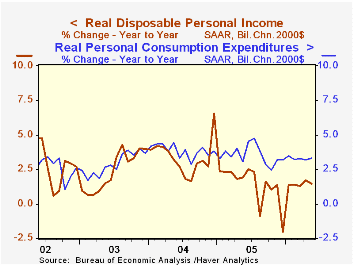
Disposable personal income rose 0.3% (4.7% y/y) after an upwardly revised 0.6% April jump. Personal taxes rose 0.5% (10.6% y/y).
Adjusted for price inflation, disposable personal income fell slightly (+1.4% y/y) marking the third m/m decline this year. A 0.1% decline in real disposable income per capita (+0.5% y/y) left the measure down 0.4% year to date.Personal consumption matched Consensus expectations for a 0.4% rise but adjusted for price inflation spending rose just 0.1% (3.3% y/y). Real spending on durables dropped 0.6% (+4.7% y/y) reflecting lower sales of motor vehicle & parts (-1.9% y/y) while real spending on furniture & household equipment rose 0.3% (12.7% y/y).
The personal savings rate was again negative.
The Trend Growth Rate of Employment: Past, Present and Future from the Federal Reserve Bank of Kansas City is available here.
| Disposition of Personal Income | May | April | Y/Y | 2005 | 2004 | 2003 |
|---|---|---|---|---|---|---|
| Personal Income | 0.4% | 0.7% | 5.4% | 5.4% | 5.9% | 3.2% |
| Personal Consumption | 0.4% | 0.7% | 6.7% | 6.5% | 6.5% | 4.9% |
| Savings Rate | -1.7% | -1.6% | 0.0% (May '05) | -0.5% | 1.7% | 2.1% |
| PCE Chain Price Index | 0.4% | 0.5% | 3.3% | 2.8% | 2.6% | 1.9% |
| Less food & energy | 0.2% | 0.2% | 2.1% | 2.0% | 2.0% | 1.3% |

Tom Moeller
AuthorMore in Author Profile »Prior to joining Haver Analytics in 2000, Mr. Moeller worked as the Economist at Chancellor Capital Management from 1985 to 1999. There, he developed comprehensive economic forecasts and interpreted economic data for equity and fixed income portfolio managers. Also at Chancellor, Mr. Moeller worked as an equity analyst and was responsible for researching and rating companies in the economically sensitive automobile and housing industries for investment in Chancellor’s equity portfolio. Prior to joining Chancellor, Mr. Moeller was an Economist at Citibank from 1979 to 1984. He also analyzed pricing behavior in the metals industry for the Council on Wage and Price Stability in Washington, D.C. In 1999, Mr. Moeller received the award for most accurate forecast from the Forecasters' Club of New York. From 1990 to 1992 he was President of the New York Association for Business Economists. Mr. Moeller earned an M.B.A. in Finance from Fordham University, where he graduated in 1987. He holds a Bachelor of Arts in Economics from George Washington University.
More Economy in Brief


