Global| Dec 10 2007
U.S. Pending Home Sales Ticked Higher, Again
by:Tom Moeller
|in:Economy in Brief
Summary
For October, the National Association of Realtors reported that the level of pending home sales ticked 0.6% higher after a modest 1.4% rise during the prior month. The level of sales still is 18.4% below October of last year and 23.0% [...]
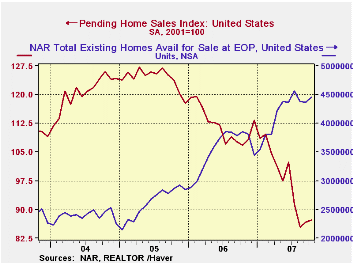
For October, the National Association of Realtors reported that the level of pending home sales ticked 0.6% higher after a modest 1.4% rise during the prior month. The level of sales still is 18.4% below October of last year and 23.0% year to date. The last two months are the first back to back gains since early last year.
The latest monthly figure is about one third below the peak level during the Summer of 2005. The data date back only to 2001.
These figures are analogous to the new home sales data from the Commerce Dept. They measure existing home sales when the sales contract is signed, not at the time the sale is closed.
The Realtors also indicated in an earlier report that the number of homes on the market and available for sale rose 1.9% in October after two months of moderate decline. The rise was to a level of 445,300 units, double the level at the low in early 2005.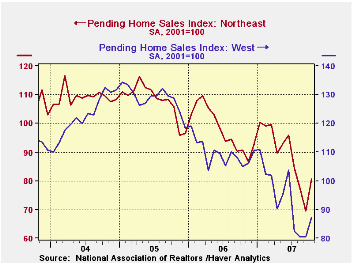
In the Northeast, pending home sales rose 6.0% m/m and recouped all of a September decline. The rise, however, followed two months a sharp drop so sales remained 20% lower than at the start of the year. Sales in the Western part of the nation also posted an 8.7% m/m rise but remained off 21% from the level early in the year.
Sales in the rest of the country were down in October. In the Midwest sales fell a slight 1.4% to remain 17% below early this year. In the South sales fell another 7.8% to a level that was 31% from the early year high.
The pending home sales data are available in Haver's PREALTOR database and the number of homes on the market are in the REALTOR database.
Housing Woes Weigh Heavily on the Economy from the Federal Reserve Bank of St. Louis can be found here.
| Pending Home Sales (2001=100) | October | September | Y/Y | 2006 | 2005 | 2004 |
|---|---|---|---|---|---|---|
| Total | 87.2 | 86.7 | -18.4% | 112.1 | 124.2 | 120.5 |
| Northeast | 80.6 | 69.5 | -11.1 | 98.0 | 108.0 | 109.2 |
| Midwest | 85.5 | 86.7 | -11.7 | 102.0 | 116.4 | 118.0 |
| South | 91.6 | 99.3 | -25.3 | 127.4 | 134.8 | 126.6 |
| West | 87.3 | 80.5 | -16.9 | 109.6 | 128.7 | 122.7 |

Tom Moeller
AuthorMore in Author Profile »Prior to joining Haver Analytics in 2000, Mr. Moeller worked as the Economist at Chancellor Capital Management from 1985 to 1999. There, he developed comprehensive economic forecasts and interpreted economic data for equity and fixed income portfolio managers. Also at Chancellor, Mr. Moeller worked as an equity analyst and was responsible for researching and rating companies in the economically sensitive automobile and housing industries for investment in Chancellor’s equity portfolio. Prior to joining Chancellor, Mr. Moeller was an Economist at Citibank from 1979 to 1984. He also analyzed pricing behavior in the metals industry for the Council on Wage and Price Stability in Washington, D.C. In 1999, Mr. Moeller received the award for most accurate forecast from the Forecasters' Club of New York. From 1990 to 1992 he was President of the New York Association for Business Economists. Mr. Moeller earned an M.B.A. in Finance from Fordham University, where he graduated in 1987. He holds a Bachelor of Arts in Economics from George Washington University.
More Economy in Brief