 Global| Nov 02 2009
U.S. Pending Home Sales Rise To Highest Since 2006
by:Tom Moeller
|in:Economy in Brief
Summary
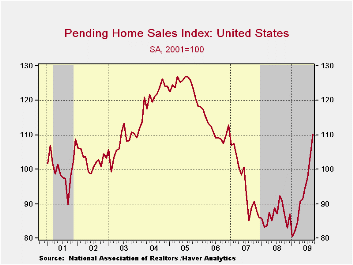
Housing demand is increasing faster than generally expected. The National Association of Realtors (NAR) reported that September pending home sales increased 6.1%. The gain was similar to the August increase and continued stronger than [...]
 Housing
demand is increasing faster than generally expected. The National
Association of Realtors (NAR) reported that September pending home
sales increased 6.1%. The gain was similar to the August increase and
continued stronger than June's 3.6% and July's 3.2% gains. Consensus
expectations had been for a slight m/m sales decline. The index level
of 110.1 was at its highest since December 2006 and up 26.9% from the
January low. The base for the index is 2001=100.
Housing
demand is increasing faster than generally expected. The National
Association of Realtors (NAR) reported that September pending home
sales increased 6.1%. The gain was similar to the August increase and
continued stronger than June's 3.6% and July's 3.2% gains. Consensus
expectations had been for a slight m/m sales decline. The index level
of 110.1 was at its highest since December 2006 and up 26.9% from the
January low. The base for the index is 2001=100.
 September sales likely were boosted by the pending expiration of an
$8,000 first-time home buyers tax credit; due to expire later this
month. Congress currently is considering extending the credit through
April of next year.
September sales likely were boosted by the pending expiration of an
$8,000 first-time home buyers tax credit; due to expire later this
month. Congress currently is considering extending the credit through
April of next year.
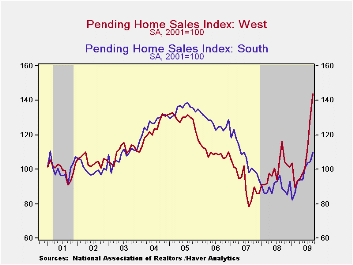
In this report only the Northeast region of the
country failed to participate in the September sales gain. Sales in the
West jumped 10.2% after a 16.0% rise during August. The sales index
here was at its all-time high. Elsewhere, sales in the Midwest gained
8.1% on top of a 3.1% rise in August. 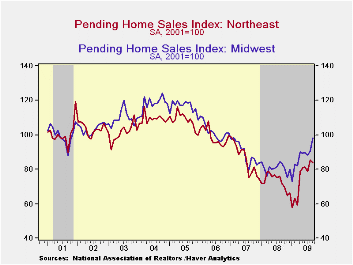 They were up more than one-third
from the January low. Sales in the South were the laggards with just a
4.9% gain but they also were up one-third from the January trough.
Sales in the Northeast slipped 2.0% during September, down for the
second month in the last three but still 44.6% higher than the January
low.
They were up more than one-third
from the January low. Sales in the South were the laggards with just a
4.9% gain but they also were up one-third from the January trough.
Sales in the Northeast slipped 2.0% during September, down for the
second month in the last three but still 44.6% higher than the January
low.
These home sales figures are analogous to the new home sales data from the Commerce Department in that they measure existing home sales when the sales contract is signed, not at the time the sale is closed. The series dates back to 2001.
The pending home sales data are available in Haver's PREALTOR database. The number of homes on the market and prices are in the REALTOR database.
| Pending Home Sales (2001=100) | September | August | July | Y/Y | 2008 | 2007 | 2006 |
|---|---|---|---|---|---|---|---|
| Total | 110.1 | 103.8 | 97.6 | 21.1% | 86.8 | 95.8 | 112.1 |
| Northeast | 83.6 | 85.3 | 78.8 | 16.9 | 73.1 | 85.9 | 98.9 |
| Midwest | 98.2 | 90.8 | 88.1 | 17.7 | 80.6 | 89.5 | 101.9 |
| South | 109.7 | 104.6 | 103.8 | 22.8 | 89.6 | 107.3 | 127.2 |
| West | 143.8 | 130.5 | 112.5 | 23.6 | 99.5 | 92.3 | 109.6 |

Tom Moeller
AuthorMore in Author Profile »Prior to joining Haver Analytics in 2000, Mr. Moeller worked as the Economist at Chancellor Capital Management from 1985 to 1999. There, he developed comprehensive economic forecasts and interpreted economic data for equity and fixed income portfolio managers. Also at Chancellor, Mr. Moeller worked as an equity analyst and was responsible for researching and rating companies in the economically sensitive automobile and housing industries for investment in Chancellor’s equity portfolio. Prior to joining Chancellor, Mr. Moeller was an Economist at Citibank from 1979 to 1984. He also analyzed pricing behavior in the metals industry for the Council on Wage and Price Stability in Washington, D.C. In 1999, Mr. Moeller received the award for most accurate forecast from the Forecasters' Club of New York. From 1990 to 1992 he was President of the New York Association for Business Economists. Mr. Moeller earned an M.B.A. in Finance from Fordham University, where he graduated in 1987. He holds a Bachelor of Arts in Economics from George Washington University.
More Economy in Brief


