 Global| Dec 01 2009
U.S. Pending Home Sales Rise Further
by:Tom Moeller
|in:Economy in Brief
Summary
Home sales continued to rebound in October, spurred by low interest rates and a tax credit. The National Association of Realtors (NAR) reported that October pending home sales increased 3.7%. It was the ninth consecutive monthly gain [...]
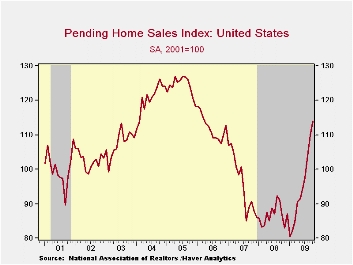 Home sales
continued to rebound in October, spurred by low interest rates and a
tax credit. The National Association of Realtors (NAR) reported that
October pending home sales increased 3.7%. It was the ninth consecutive
monthly gain and sales are up 41.9% from the low. Consensus
expectations had been for a slight m/m sales decline. The index level
of 114.1 was at its highest since March 2006. The base for the index is
2001=100.
Home sales
continued to rebound in October, spurred by low interest rates and a
tax credit. The National Association of Realtors (NAR) reported that
October pending home sales increased 3.7%. It was the ninth consecutive
monthly gain and sales are up 41.9% from the low. Consensus
expectations had been for a slight m/m sales decline. The index level
of 114.1 was at its highest since March 2006. The base for the index is
2001=100.
October sales likely were boosted by the pending expiration of an $8,000 first-time home buyers tax credit. The credit has since been extended into next year.
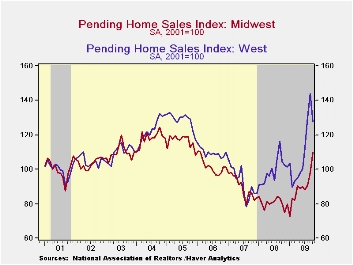
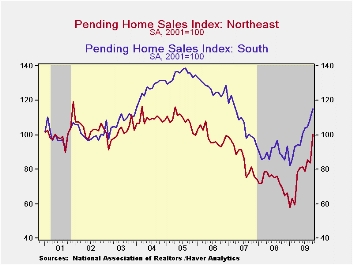 Only the Western region
of the country failed to participate in the October sales gain. Sales
reversed the September increase but were still up by nearly one-quarter
from last year. Elsewhere, sales in the Northeast more-than made up a
September decline with a 19.9% jump. Sales in the Midwest rose 11.6% to
the highest level since early-2006. Sales in the South were the
laggards again with just a 5.4% gain but they also were up one-third
from the January trough.
Only the Western region
of the country failed to participate in the October sales gain. Sales
reversed the September increase but were still up by nearly one-quarter
from last year. Elsewhere, sales in the Northeast more-than made up a
September decline with a 19.9% jump. Sales in the Midwest rose 11.6% to
the highest level since early-2006. Sales in the South were the
laggards again with just a 5.4% gain but they also were up one-third
from the January trough.
 These home sales figures are analogous to
the new home sales data from the Commerce Department in that they
measure existing home sales when the sales contract is signed, not at
the time the sale is closed. The series dates back to
2001.
These home sales figures are analogous to
the new home sales data from the Commerce Department in that they
measure existing home sales when the sales contract is signed, not at
the time the sale is closed. The series dates back to
2001.
The pending home sales data are available in Haver's PREALTOR database. The number of homes on the market and prices are in the REALTOR database.
How Rigid Are Producer Prices? from the Federal Reserve Bank of New York is available here.
| Pending Home Sales (2001=100) | October | September | August | Y/Y | 2008 | 2007 | 2006 |
|---|---|---|---|---|---|---|---|
| Total | 114.1 | 110.0 | 103.8 | 31.8% | 86.8 | 95.8 | 112.1 |
| Northeast | 100.2 | 83.6 | 85.3 | 44.2 | 73.1 | 85.9 | 98.9 |
| Midwest | 109.6 | 98.2 | 90.8 | 36.5 | 80.6 | 89.5 | 101.9 |
| South | 115.4 | 109.5 | 104.6 | 31.6 | 89.6 | 107.3 | 127.2 |
| West | 127.7 | 143.8 | 130.5 | 22.0 | 99.5 | 92.3 | 109.6 |

Tom Moeller
AuthorMore in Author Profile »Prior to joining Haver Analytics in 2000, Mr. Moeller worked as the Economist at Chancellor Capital Management from 1985 to 1999. There, he developed comprehensive economic forecasts and interpreted economic data for equity and fixed income portfolio managers. Also at Chancellor, Mr. Moeller worked as an equity analyst and was responsible for researching and rating companies in the economically sensitive automobile and housing industries for investment in Chancellor’s equity portfolio. Prior to joining Chancellor, Mr. Moeller was an Economist at Citibank from 1979 to 1984. He also analyzed pricing behavior in the metals industry for the Council on Wage and Price Stability in Washington, D.C. In 1999, Mr. Moeller received the award for most accurate forecast from the Forecasters' Club of New York. From 1990 to 1992 he was President of the New York Association for Business Economists. Mr. Moeller earned an M.B.A. in Finance from Fordham University, where he graduated in 1987. He holds a Bachelor of Arts in Economics from George Washington University.
More Economy in Brief


