 Global| Jul 08 2008
U.S. Pending Home Sales Reversed Most of the April Improvement
by:Tom Moeller
|in:Economy in Brief
Summary
The National Association of Realtors reported that the level of pending sales of existing homes in May fell by 4.7% and reversed most of the 7.1% April gain. That was upwardly revised. The decline exceeded Consensus expectations for a [...]
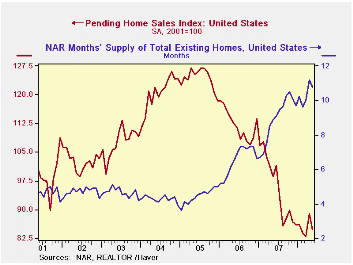
The National Association of Realtors reported that the level of pending sales of existing homes in May fell by 4.7% and reversed most of the 7.1% April gain. That was upwardly revised. The decline exceeded Consensus expectations for a 2.5% drop.
These figures are analogous to the new home sales data from the Commerce Department in that they measure existing home sales when the sales contract is signed, not at the time the sale is closed. The series dates back to 2001.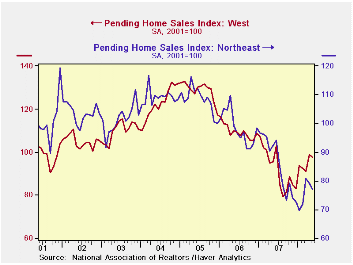
The regional figures indicate that sales out West fell a modest 1.3% after the 8.3% surge during April. Elsewhere in the country, sales continued weak. Sales in the Northeast fell 2.9% after a 1.9% fall in April. Sales in the Midwest retraced about half of the April gain with a 6.0% decline. Sales in the South reversed all of their upwardly revised April rise with a 7.1% decline.
The Realtors association indicated in an earlier report that the number of homes on the market & available for sale slipped a not seasonally adjusted 1.4% (+2.4% y/y) after a 10.5% jump during April.
At the current sales rate there was a 10.8 months' supply of homes on the market versus an 8.9 months' average during all of last year, a 6.5 months' supply in 2006 and a 4.5 months' supply in 2005.
The pending home sales data are available in Haver's PREALTOR database and the number of homes on the market are in the REALTOR database.
| Pending Home Sales (2001=100) | May | April | Y/Y | 2007 | 2006 | 2005 |
|---|---|---|---|---|---|---|
| Total | 84.7 | 88.9 | -14.0% | 95.7 | 112.1 | 124.3 |
| Northeast | 77.0 | 79.3 | -16.5 | 85.6 | 98.5 | 108.3 |
| Midwest | 78.6 | 83.6 | -13.8 | 89.6 | 102.0 | 116.4 |
| South | 84.5 | 91.0 | -22.1 | 107.3 | 127.3 | 134.8 |
| West | 97.5 | 98.8 | 2.0 | 92.1 | 109.5 | 128.6 |

Tom Moeller
AuthorMore in Author Profile »Prior to joining Haver Analytics in 2000, Mr. Moeller worked as the Economist at Chancellor Capital Management from 1985 to 1999. There, he developed comprehensive economic forecasts and interpreted economic data for equity and fixed income portfolio managers. Also at Chancellor, Mr. Moeller worked as an equity analyst and was responsible for researching and rating companies in the economically sensitive automobile and housing industries for investment in Chancellor’s equity portfolio. Prior to joining Chancellor, Mr. Moeller was an Economist at Citibank from 1979 to 1984. He also analyzed pricing behavior in the metals industry for the Council on Wage and Price Stability in Washington, D.C. In 1999, Mr. Moeller received the award for most accurate forecast from the Forecasters' Club of New York. From 1990 to 1992 he was President of the New York Association for Business Economists. Mr. Moeller earned an M.B.A. in Finance from Fordham University, where he graduated in 1987. He holds a Bachelor of Arts in Economics from George Washington University.
More Economy in Brief


