 Global| Jun 09 2008
U.S. Pending Home Sales in April Rose Unexpectedly
by:Tom Moeller
|in:Economy in Brief
Summary
The National Association of Realtors reported that the level of pending sales of existing homes rose an unexpected 6.3% during April. A slight decline in sales had been the Consensus expectation. While a m/m rise in sales is normally [...]
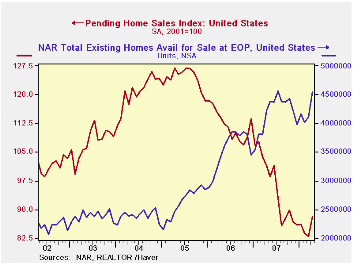
The National Association of Realtors reported that the level of pending sales of existing homes rose an unexpected 6.3% during April. A slight decline in sales had been the Consensus expectation.
While a m/m rise in sales is normally expected due to the warming of temperatures after Winter, the m/m increase was the series' strongest. Nevertheless, sales remained down 13.1% from last April after the 14.6% decline during all of 2007.
These figures are analogous to the new home sales data from the Commerce Department in that they measure existing home sales when the sales contract is signed, not at the time the sale is closed. The series dates back to 2001.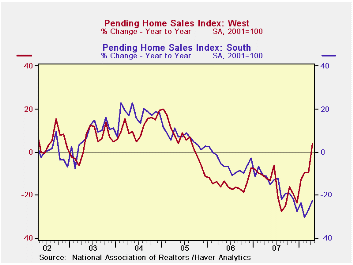
The regional figures indicate a surprising improvement in sales out West which rose 8.3% and by 4.0% y/y. That was the first y/y increase since the middle of 2005. Elsewhere in the country, sales continued to meander with a 1.9% m/m decline in sales in the Northeast. A 13.0% rise in sales in the Midwest left them still down 13.2% from last year as it followed a 10.4% March drop. Sales in the South rose 4.6% m/m but remained down a hefty 22.5% from a year earlier.
The Realtors association indicated in an earlier report that the number of homes on the market & available for sale surged a not seasonally adjusted 10.5% (7.9% y/y) during April. The rise was indeed strong and rivaled past year's April gains. However, it likely reflected a rise usual for the Spring sales season. It followed five months when home inventories declined. As a result the y/y change in the inventory of unsold homes held steady with the prior three months at 7.9% which was down sharply from the 40% growth rates logged during 2006.
At the current sales rate there was an 11.2 months' supply of homes on the market versus an 8.9 months' average during all of last year, a 6.5 months' supply in 2006 and a 4.5 months' supply in 2005. The latest figure was elevated by the low sales rate.
The pending home sales data are available in Haver's PREALTOR database and the number of homes on the market are in the REALTOR database.
| Pending Home Sales (2001=100) | April | March | Y/Y | 2007 | 2006 | 2005 |
|---|---|---|---|---|---|---|
| Total | 88.2 | 83.0 | -13.1% | 95.7 | 112.1 | 124.3 |
| Northeast | 79.3 | 80.8 | -12.3 | 85.6 | 98.5 | 108.3 |
| Midwest | 83.7 | 74.1 | -13.2 | 89.6 | 102.0 | 116.4 |
| South | 88.8 | 84.9 | -22.5 | 107.3 | 127.3 | 134.8 |
| West | 98.8 | 91.2 | 4.0 | 92.1 | 109.5 | 128.6 |

Tom Moeller
AuthorMore in Author Profile »Prior to joining Haver Analytics in 2000, Mr. Moeller worked as the Economist at Chancellor Capital Management from 1985 to 1999. There, he developed comprehensive economic forecasts and interpreted economic data for equity and fixed income portfolio managers. Also at Chancellor, Mr. Moeller worked as an equity analyst and was responsible for researching and rating companies in the economically sensitive automobile and housing industries for investment in Chancellor’s equity portfolio. Prior to joining Chancellor, Mr. Moeller was an Economist at Citibank from 1979 to 1984. He also analyzed pricing behavior in the metals industry for the Council on Wage and Price Stability in Washington, D.C. In 1999, Mr. Moeller received the award for most accurate forecast from the Forecasters' Club of New York. From 1990 to 1992 he was President of the New York Association for Business Economists. Mr. Moeller earned an M.B.A. in Finance from Fordham University, where he graduated in 1987. He holds a Bachelor of Arts in Economics from George Washington University.
More Economy in Brief


