 Global| Oct 05 2012
U.S. Payroll Gain Remains Moderate; Jobless Rate At Lowest Level Since January 2009
by:Tom Moeller
|in:Economy in Brief
Summary
Labor market improvement is continuing. Nonfarm payrolls grew 114,000 during September following revised gains of 142,000 and 181,000 during the prior two months, earlier reported as 96,000 and 141,000, respectively. A 120,000 [...]
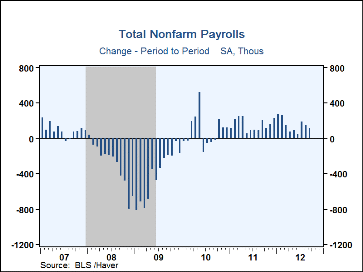
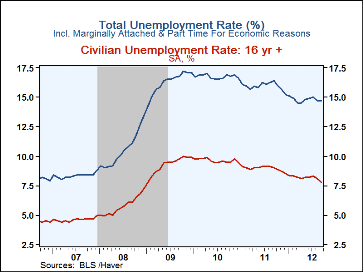
Labor market improvement is continuing. Nonfarm payrolls grew 114,000 during September following revised gains of 142,000 and 181,000 during the prior two months, earlier reported as 96,000 and 141,000, respectively. A 120,000 increase was expected. Moderate job gains continued in most industries although government payroll growth was stronger than indicated earlier. The unemployment rate fell to 7.8% versus expectations for an uptick to 8.2%. Employment surged 873,000 as measured in the household survey.
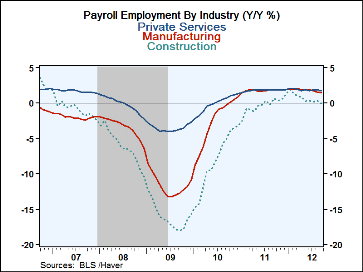
While the 114,000 gain in nonfarm payrolls looks OK overall, just 50.2% of private industries raised employment last month, the least since February 2010. During the last three months only 54.5% of industries grew payrolls, also the least since 2010. Moreover, though the August jobs gain was raised, it mostly reflected state government payrolls where revisions lifted the tally to +35,000 from a 6,000 decline reported initially. In the private sector, payrolls grew a steady 104,000 (1.7% y/y) last month although that remained less than half the Q1 rate of increase. What strength there was continued to be centered in the service sector where payrolls rose 114,000 (1.8% y/y). Factory sector payrolls fell 16,000 (+1.5% y/y, down for the second straight month and construction employment grew a modest 5,000 (-0.1% y/y), up for the fourth straight period.
Average weekly hours ticked up m/m to 34.5 although the Q3 average remained slightly below Q2. That left the index of aggregate hours worked in Q3 up at a modest 0.8% annual rate following a 0.4% Q2 rise.
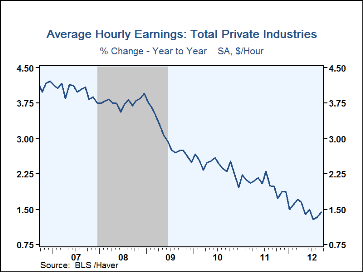
Average hourly earnings rose 0.3% (1.4% y/y), the strongest monthly rise since January of last year. Private service industries earnings grew 0.3% (1.5% y/y) but factory sector earnings were unchanged (1.1% y/y) as were construction worker earnings (0.9% y/y).
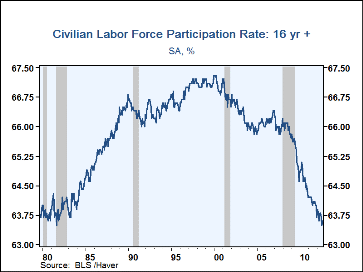
From the household employment survey, the unemployment rate fell to 7.8% from 8.1%. The decline reflected a hefty 873,000 rise (2.0% y/y) in employment, its strongest gain in roughly ten years. The labor force also grew a strong 418,000 (0.7% y/y), though the labor force participation rate, at 63.6%, remained near its lowest since 1981 and down from 67.1% averaged in the late-1990s.The overall unemployment rate, including discouraged workers and those involuntarily working part time held steady m/m at 14.7%, about where it's been all year.
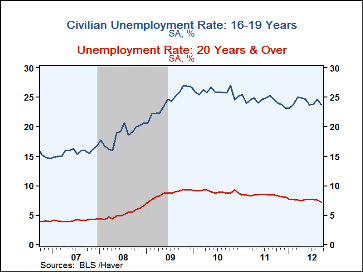
The average duration of unemployment held near its recovery high at 39.8 weeks. However, the ranks of those unemployed 27 weeks or more fell by nearly one-quarter y/y. For adult men the unemployment rate of 7.3% was down sharply from its recession high of 10.5%. However, for adult women the jobless rate of 7.0% was down just moderately from the 8.2% peak. For teenagers, the unemployment rate of 23.7% was down from the 2009 high of 26.8%.
The figures referenced above are available in Haver's USECON database. Additional detail can be found in the LABOR and in the EMPL databases. The expectation figures are from Action Economics and are in the AS1REPNA database.
| Employment: (M/M Chg., 000s) | Sep | Aug | Jul | Y/Y | 2011 | 2010 | 2009 |
|---|---|---|---|---|---|---|---|
| Payroll Employment | 114 | 142 | 181 | 1.4% | 1.2% | -0.7% | -4.4% |
| Previous | -- | 96 | 141 | -- | -- | -- | -- |
| Manufacturing | -16 | -22 | 18 | 1.5 | 1.8 | -2.7 | -11.6 |
| Construction | 5 | 1 | 3 | -0.1 | -0.3 | -8.2 | -16.0 |
| Private Service Producing | 114 | 119 | 143 | 1.8 | 1.8 | -0.1 | -3.5 |
| Government | 10 | 45 | 18 | -0.2 | -1.7 | -0.3 | 0.2 |
| Average Weekly Hours - Private Sector | 34.5 | 34.4 | 34.4 | 34. (Sep'11) |
34.4 | 34.1 | 33.9 |
| Average Private Sector Hourly Earnings (%) | 0.3 | -0.1 | 0.2 | 1.4 | 2.0 | 2.4 | 3.0 |
| Unemployment Rate (%) | 7.8 | 8.1 | 8.3 | 9.0 (Sep'11) |
9.0 | 9.6 | 9.3 |
Tom Moeller
AuthorMore in Author Profile »Prior to joining Haver Analytics in 2000, Mr. Moeller worked as the Economist at Chancellor Capital Management from 1985 to 1999. There, he developed comprehensive economic forecasts and interpreted economic data for equity and fixed income portfolio managers. Also at Chancellor, Mr. Moeller worked as an equity analyst and was responsible for researching and rating companies in the economically sensitive automobile and housing industries for investment in Chancellor’s equity portfolio. Prior to joining Chancellor, Mr. Moeller was an Economist at Citibank from 1979 to 1984. He also analyzed pricing behavior in the metals industry for the Council on Wage and Price Stability in Washington, D.C. In 1999, Mr. Moeller received the award for most accurate forecast from the Forecasters' Club of New York. From 1990 to 1992 he was President of the New York Association for Business Economists. Mr. Moeller earned an M.B.A. in Finance from Fordham University, where he graduated in 1987. He holds a Bachelor of Arts in Economics from George Washington University.
More Economy in Brief
 Global| Feb 05 2026
Charts of the Week: Balanced Policy, Resilient Data and AI Narratives
by:Andrew Cates


