 Global| Nov 07 2003
U.S. Non-farm Payrolls Rose
by:Tom Moeller
|in:Economy in Brief
Summary
Nonfarm payrolls have been firmer during the last three months than previously perceived. October payrolls rose 126,000 versus Consensus expectations for a 50,000 rise. September payrolls were revised to +125,000 from +57,000. August [...]
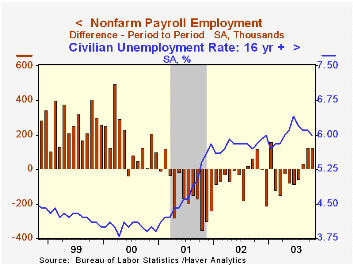
Nonfarm payrolls have been firmer during the last three months than previously perceived. October payrolls rose 126,000 versus Consensus expectations for a 50,000 rise. September payrolls were revised to +125,000 from +57,000. August payrolls were revised to +35,000 from -41,000.
Job growth during these three months amounts to 0.9% (AR), the strongest three-month growth since January 2001.
The one-month diffusion index (breadth of gain) for private nonfarm payrolls fell slightly to 48.2.
Service producing jobs rose 143,000 (0.2% y/y) and were the source for most of the upward revisions to payrolls. The gains were widespread amongst service industries.
Strong monthly gains were logged in temporary help services (4.0% y/y), education & health (1.9% y/y), professional & business services (0.8% y/y), retail trade (-0.1% y/y) and leisure (0.4% y/y). Government sector jobs rose 10,000 (-0.3% y/y).
Declines in manufacturing sector payrolls continued, down another 24,000 (-4.0% y/y). The one-month diffusion index for factory payrolls was unchanged at a quite low 29.8. Construction jobs rose 6,000 (1.9% y/y).
From the separate household survey, the unemployment rate fell to 6.0% versus expectations for 6.1%. Employment surged 441,000 (0.7% y/y) following a slight September drop. The labor force jumped 248,000 (1.0% y/y).
Average hourly earnings rose a modest 0.1%, a 2.1% rate YTD.
The index of aggregate hours worked rose 0.4% and was up at a 2.0% annual rate from 3Q. Hours worked fell in 3Q versus 2Q.
| Employment | Oct | Sept | Y/Y | 2002 | 2001 | 2000 |
|---|---|---|---|---|---|---|
| Payroll Employment | 126,000 | 125,000 | -0.2% | -1.1% | 0.0% | 2.2% |
| Manufacturing | -24,000 | -28,000 | -4.0% | -6.9% | -4.8% | -0.3% |
| Average Weekly Hours | 33.8 | 33.7 | 33.8 | 33.9 | 34.0 | 34.3 |
| Average Hourly Earnings | 0.1% | 0.0% | 2.4% | 2.9% | 3.8% | 3.9% |
| Unemployment Rate | 6.0% | 6.1% | 5.8% | 5.8% | 4.8% | 4.0% |
by Tom Moeller November 7, 2003
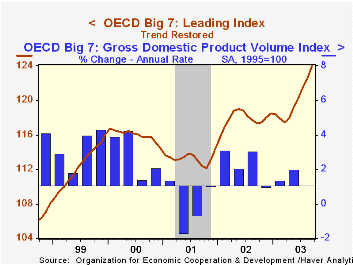
The OECD Index of Leading Indicators (Big 7) rose in September for the sixth consecutive month. The 1.1% increase was the strongest monthly increase since February 2002.
The latest increase pulled the leading index up to its trend level.
Gains amongst the member country leading indexes were broad and strong. The leading index for the European Union rose 1.0% (3.5% y/y), the strongest monthly gain since 1975.
In France, the leading index rose 0.6% (2.9% y/y) and tepid gains in recent months were revised up sharply. The leaders in Germany jumped 1.2% (4.9% y/y. In Italy the leaders surged 1.8% (2.7% y/y).
Leaders in Japan, up 1.5%, posted the strongest one month gain since 1987. The three-month growth rate remained strong at 14.3%.
In Canada the September leading index surged for the second month, up 1.5% (5.0% y/y). In the U.K. the leaders managed the sixth respectable monthly increase in September, up 0.4% m/m (0.0% y/y).
Leading indicators in the United States rose strongly for the sixth straight month.
Visit the OECD's website at this website.
| OECD Main Economic Indicators | Sept | Aug | Y/Y | 2002 | 2001 | 2000 |
|---|---|---|---|---|---|---|
| OECD Major Seven - Leading Index (Trend Restored) | 124.0 | 122.6 | 5.7% | 4.0% | -2.3% | 3.1% |
| European Union | 120.8 | 119.6 | 3.5% | 3.1% | -1.9% | 3.7% |
| Japan | 106.0 | 104.5 | 5.0% | 0.7% | -2.9% | 2.5% |
| United States | 135.9 | 134.8 | 7.6% | 5.6% | -2.7% | 2.7% |

Tom Moeller
AuthorMore in Author Profile »Prior to joining Haver Analytics in 2000, Mr. Moeller worked as the Economist at Chancellor Capital Management from 1985 to 1999. There, he developed comprehensive economic forecasts and interpreted economic data for equity and fixed income portfolio managers. Also at Chancellor, Mr. Moeller worked as an equity analyst and was responsible for researching and rating companies in the economically sensitive automobile and housing industries for investment in Chancellor’s equity portfolio. Prior to joining Chancellor, Mr. Moeller was an Economist at Citibank from 1979 to 1984. He also analyzed pricing behavior in the metals industry for the Council on Wage and Price Stability in Washington, D.C. In 1999, Mr. Moeller received the award for most accurate forecast from the Forecasters' Club of New York. From 1990 to 1992 he was President of the New York Association for Business Economists. Mr. Moeller earned an M.B.A. in Finance from Fordham University, where he graduated in 1987. He holds a Bachelor of Arts in Economics from George Washington University.
More Economy in Brief


