 Global| Mar 05 2004
U.S. Non-farm Payroll Growth Slowed
by:Tom Moeller
|in:Economy in Brief
Summary
Growth in non-farm payrolls slowed last month to 21,000 (0.0%) from the downwardly revised 97,000 January gain. Consensus expectations had been for a rise of 125,000. A weak 46,000 (0.4% y/y) gain in service producing payrolls was the [...]
Growth in non-farm payrolls slowed last month to 21,000 (0.0%) from the downwardly revised 97,000 January gain. Consensus expectations had been for a rise of 125,000.
A weak 46,000 (0.4% y/y) gain in service producing payrolls was the source of last month's disappointment. Monthly gains of just 0.1% were spread across industries except in the leisure and "other" categories where payrolls fell. A sign of strength came from the temporary help services industry where jobs jumped 32,000 (9.1% y/y).
Construction jobs also disappointed and fell 24,000 (+1.8% y/y).
Manufacturing sector payrolls fell 3,000 (-3.1% y/y), the smallest monthly decline since 2000. Perhaps signaling better prospects for factory sector jobs, the one-month diffusion index for manufacturing payrolls rose to 51.8%, the highest level since 2000.
The index of aggregate hours worked (employment times hours worked) fell 0.1% following the downwardly revised 0.6% January gain. Aggregate hours so far in 1Q are up 1.0% (AR) from the 4Q average.
The one-month diffusion index for private non-farm payrolls fell to 50.9% from the upwardly revised 51.1% in January.
Average hourly earnings rose 0.2% (1.6% y/y). Earnings in the factory sector rose 0.2% (2.3% y/y) following a 0.1% January gain, revised from -0.6%.
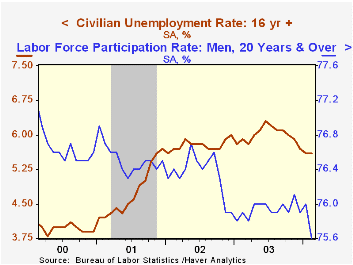
From the separate household survey, the unemployment rate held steady at 5.6%, as expected.
Household employment fell 265,000 (+0.7% y/y) and the labor force fell 392,000 (+0.4% y/y). The labor force participation rate dropped further to 65.9% versus 67.1% averaged from 1997-2000.
"Your Current Job Probably Won't Be Your Last" from the Federal Reserve Bank of St. Louis is available here.
| Employment | Feb | Jan | Y/Y | 2003 | 2002 | 2001 |
|---|---|---|---|---|---|---|
| Payroll Employment | 21,000 | 97,000 | 0.1% | -0.3% | -1.1% | 0.0% |
| Manufacturing | -3,000 | -13,000 | -3.1% | -4.8% | -7.2% | -4.8% |
| Average Weekly Hours | 33.8 | 33.8 | 33.7 | 33.7 | 33.8 | 34.0 |
| Average Hourly Earnings | 0.2% | 0.3% | 1.6% | 2.7% | 2.9% | 3.8% |
| Unemployment Rate | 5.6% | 5.6% | 5.9% | 6.0% | 5.8% | 4.8% |

Tom Moeller
AuthorMore in Author Profile »Prior to joining Haver Analytics in 2000, Mr. Moeller worked as the Economist at Chancellor Capital Management from 1985 to 1999. There, he developed comprehensive economic forecasts and interpreted economic data for equity and fixed income portfolio managers. Also at Chancellor, Mr. Moeller worked as an equity analyst and was responsible for researching and rating companies in the economically sensitive automobile and housing industries for investment in Chancellor’s equity portfolio. Prior to joining Chancellor, Mr. Moeller was an Economist at Citibank from 1979 to 1984. He also analyzed pricing behavior in the metals industry for the Council on Wage and Price Stability in Washington, D.C. In 1999, Mr. Moeller received the award for most accurate forecast from the Forecasters' Club of New York. From 1990 to 1992 he was President of the New York Association for Business Economists. Mr. Moeller earned an M.B.A. in Finance from Fordham University, where he graduated in 1987. He holds a Bachelor of Arts in Economics from George Washington University.
More Economy in Brief


