 Global| Nov 25 2015
U.S. New Home Sales Rise M/M but Tread Water This Year
by:Tom Moeller
|in:Economy in Brief
Summary
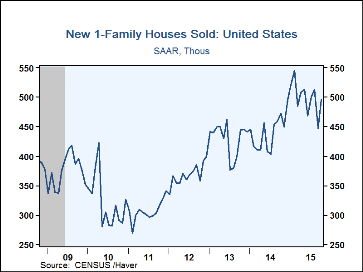
Sales of new single-family homes increased 10.7% during October to 495,000 (AR) from 447,000 in September, revised from 468,000. The gain left sales up 4.9% y/y but unchanged since December. Sales of 500,000 had been expected in the [...]
Sales of new single-family homes increased 10.7% during October to 495,000 (AR) from 447,000 in September, revised from 468,000. The gain left sales up 4.9% y/y but unchanged since December. Sales of 500,000 had been expected in the Action Economics Forecast Survey. The rise contrasts to Monday's report of a 3.7% decline in existing single-family homes.
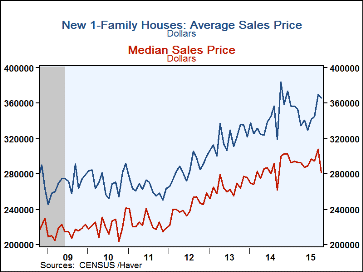
The median price of a new home plunged 8.5% from September and was down 6.0% y/y. The average sales price declined 1.0% m/m and was off 4.7% y/y.
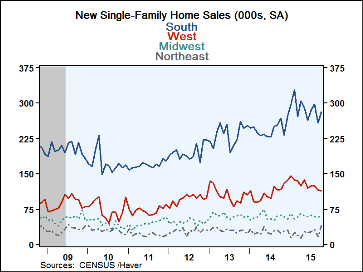
Home sales in the Northeast more-than-doubled to 40,000 following a sharp decline in September. Sales were at the highest level since January 2010. Sales in the South also were firm, rising 8.9% to 281,000 (5.2% y/y). Sales in the Midwest gained 5.3% to 60,000 but were down 4.8% y/y. Home sales in the West eased 0.9% to 114,000 and were off 2.6% y/y.
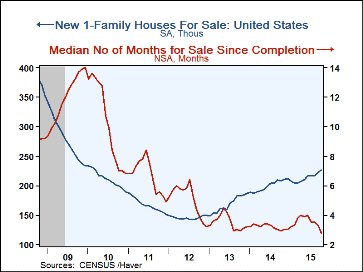
The inventory of unsold homes increased 8.7% y/y and there was 5.5 months supply at the current sales rate. That figure is up slightly from 4.8 months at the beginning of the year. The median number of months a new home was for sale fell to a record low of 2.8.
The data in this report are available in Haver's USECON database. The consensus expectation figure from the Action Economics Forecast Survey is available in the AS1REPNA database.
Five Questions Related to U.S. Monetary Policy is the title of St. Louis Fed President & CEO James Bullard's speech and it can be found here.
| U.S. New Single-Family Home Sales (SAAR, 000s) | Oct | Sep | Aug | Y/Y %, SA | 2014 | 2013 | 2012 |
|---|---|---|---|---|---|---|---|
| Total | 495 | 447 | 513 | 4.9 | 440 | 430 | 368 |
| Northeast | 40 | 17 | 32 | 60.0 | 28 | 31 | 29 |
| Midwest | 60 | 57 | 59 | -4.8 | 58 | 61 | 47 |
| South | 281 | 258 | 297 | 5.2 | 244 | 233 | 195 |
| West | 114 | 115 | 125 | -2.6 | 110 | 106 | 97 |
| Median Price (NSA, $) | 281,500 | 307,800 | 294,600 | -6.0 | 283,775 | 265,092 | 242,108 |
Tom Moeller
AuthorMore in Author Profile »Prior to joining Haver Analytics in 2000, Mr. Moeller worked as the Economist at Chancellor Capital Management from 1985 to 1999. There, he developed comprehensive economic forecasts and interpreted economic data for equity and fixed income portfolio managers. Also at Chancellor, Mr. Moeller worked as an equity analyst and was responsible for researching and rating companies in the economically sensitive automobile and housing industries for investment in Chancellor’s equity portfolio. Prior to joining Chancellor, Mr. Moeller was an Economist at Citibank from 1979 to 1984. He also analyzed pricing behavior in the metals industry for the Council on Wage and Price Stability in Washington, D.C. In 1999, Mr. Moeller received the award for most accurate forecast from the Forecasters' Club of New York. From 1990 to 1992 he was President of the New York Association for Business Economists. Mr. Moeller earned an M.B.A. in Finance from Fordham University, where he graduated in 1987. He holds a Bachelor of Arts in Economics from George Washington University.
More Economy in Brief
 Global| Feb 05 2026
Charts of the Week: Balanced Policy, Resilient Data and AI Narratives
by:Andrew Cates


