 Global| Oct 23 2012
U.S. Mass Layoffs Fall Further
by:Tom Moeller
|in:Economy in Brief
Summary
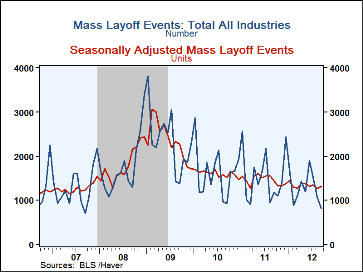
Fewer payrolls were cut back last month. The Labor Department reported that layoffs of 50 or more persons from a single firm fell to 811, the lowest level since September 2007; down nearly by one-third y/y. However, this decline was [...]
Fewer payrolls were cut back last month. The Labor Department reported that layoffs of 50 or more persons from a single firm fell to 811, the lowest level since September 2007; down nearly by one-third y/y. However, this decline was to be expected given the time of year. On a seasonally adjusted basis mass layoff events ticked up to 1,316.
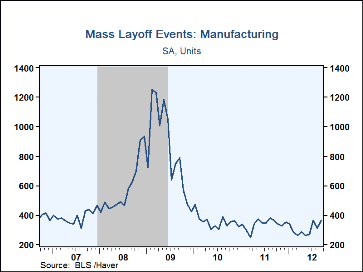
In September, large m/m declines were spread throughout industries. In construction they fell nearly one-third m/m and by more than one-half y/y. In manufacturing they fell 12.0% (-25.3% y/y) but rose slightly when seasonally adjusted. Retail trade layoffs were off by more than one-half m/m and y/y. In retail trade they were stable m/m and down 8.3% y/y. In most other industries layoff events fell sharply except in arts, entertainment & recreation industries. Here, there were nearly one-third more claims versus August and 11.1% more y/y.
There were 70,570 (-39.8% y/y) initial claims for unemployment insurance accompanying these layoffs; 22,748 (-29.0% y/y) in manufacturing and 6,930 (-45.9% y/y) in retail trade.
A mass layoff involves at least 50 initial claimants from a single establishment filing during a consecutive 5-week period. The BLS data are available in Haver's USECON database. Underlying state and area detail are available in the REGIONAL database.
| Mass Layoffs (NSA) | Sep | Aug | Jul | Sep Y/Y | 2011 | 2010 | 2009 |
|---|---|---|---|---|---|---|---|
| Total All Industries | 811 | 1,063 | 1,715 | -31.8% | 18,521 | 19,564 | 28,030 |
| Private Nonfarm | 768 | 1,016 | 1,385 | -30.7 | 17,046 | 17,887 | 26,437 |
| Construction | 65 | 96 | 86 | -56.7 | 1,994 | 2,262 | 2,833 |
| Manufacturing | 221 | 251 | 559 | -25.3 | 4,397 | 4,523 | 9,627 |
| Retail Trade | 86 | 115 | 92 | -28.3 | 1,448 | 1,574 | 1,965 |
| Information | 33 | 33 | 32 | -8.3 | 522 | 548 | 752 |
| Finance & Insurance | 13 | 28 | 24 | -40.9 | 313 | 430 | 677 |
| Health Care & Social Assistance | 28 | 31 | 56 | -28.2 | 738 | 709 | 675 |
| Arts, Entertainment and Recreation | 30 | 23 | 14 | 11.1 | 338 | 363 | 389 |
| Government | 43 | 47 | 130 | -46.9 | 1,475 | 1,677 | 1,593 |
Tom Moeller
AuthorMore in Author Profile »Prior to joining Haver Analytics in 2000, Mr. Moeller worked as the Economist at Chancellor Capital Management from 1985 to 1999. There, he developed comprehensive economic forecasts and interpreted economic data for equity and fixed income portfolio managers. Also at Chancellor, Mr. Moeller worked as an equity analyst and was responsible for researching and rating companies in the economically sensitive automobile and housing industries for investment in Chancellor’s equity portfolio. Prior to joining Chancellor, Mr. Moeller was an Economist at Citibank from 1979 to 1984. He also analyzed pricing behavior in the metals industry for the Council on Wage and Price Stability in Washington, D.C. In 1999, Mr. Moeller received the award for most accurate forecast from the Forecasters' Club of New York. From 1990 to 1992 he was President of the New York Association for Business Economists. Mr. Moeller earned an M.B.A. in Finance from Fordham University, where he graduated in 1987. He holds a Bachelor of Arts in Economics from George Washington University.


