 Global| Apr 11 2008
U.S. March Budget Deficit Shallower, 2008 FYTD Deeper
by:Tom Moeller
|in:Economy in Brief
Summary
The U.S. government ran a budget deficit of $48.1B during March, down from last year's March deficit of $96.3B. Despite that decline, for the first six months of FY08 the government ran a budget deficit of $311.4B, up sharply from [...]
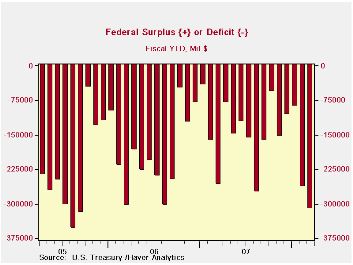
The U.S. government ran a budget deficit of $48.1B during March, down from last year's March deficit of $96.3B. Despite that decline, for the first six months of FY08 the government ran a budget deficit of $311.4B, up sharply from last fiscal year's deficit of $258.4B during the first six months.
For the fiscal year to date, federal receipts grew just 2.2% from a year earlier. That was down sharply from 6.0% growth during the first six months of FY07. The weaker economy and lower stock prices continued to restrain government revenues. Individual income tax receipts (44% of total receipts) grew 5.1% from the first six months of FY07. That was half the y/y growth logged last year. Withheld income taxes grew 5.9%, down from 8.9% last year. Finally, non-withheld taxes grew 5.1%, one third the rate of the first six months of FY07.
Lower corporate profitability hurt government revenues further. Corporate income taxes (13% of total receipts) amounted to $158.9B, a 7.1% drop from corporate receipts tallied during the first six months of FY07. During FY07 they rose 15.4% during the first six months.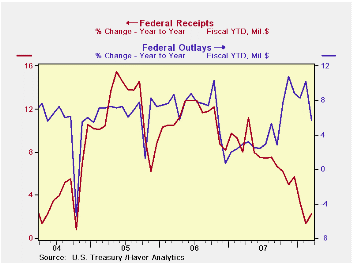
Unemployment insurance contributions fell 6.1% due to negative employment growth and that about repeated the 4.1% decline during the first six months of FY07.
U.S. net outlays grew 5.7% during the first six months of FY08, nearly triple the growth in revenues and double the outlay growth of FY07's first six months. Growth in defense spending (19% of total outlays) totaled 8.5%, up from 6.3% last FYTD but Medicare expenditures (12% of outlays) fell 5.1%. Social security spending (21% of outlays) held about steady at 5.5% and interest expense rose 12.7% as interest rates rose.
The Government's financial data is available in Haver's USECON database.
| US Government Finance | March | February | Y/Y | FY 2007 | FY 2006 | FY 2005 |
|---|---|---|---|---|---|---|
| Budget Balance | -$48.1B | -$175.6B | -$96.3B (3/07) | -$162.0B | -$248.2B | -$318.7B |
| Net Revenues | $178.9 | $105.7B | 7.4% | 6.7% | 11.8% | 14.1% |
| Net Outlays | $227.0 | $281.3B | -13.4% | 2.8% | 7.4% | 7.6% |

Tom Moeller
AuthorMore in Author Profile »Prior to joining Haver Analytics in 2000, Mr. Moeller worked as the Economist at Chancellor Capital Management from 1985 to 1999. There, he developed comprehensive economic forecasts and interpreted economic data for equity and fixed income portfolio managers. Also at Chancellor, Mr. Moeller worked as an equity analyst and was responsible for researching and rating companies in the economically sensitive automobile and housing industries for investment in Chancellor’s equity portfolio. Prior to joining Chancellor, Mr. Moeller was an Economist at Citibank from 1979 to 1984. He also analyzed pricing behavior in the metals industry for the Council on Wage and Price Stability in Washington, D.C. In 1999, Mr. Moeller received the award for most accurate forecast from the Forecasters' Club of New York. From 1990 to 1992 he was President of the New York Association for Business Economists. Mr. Moeller earned an M.B.A. in Finance from Fordham University, where he graduated in 1987. He holds a Bachelor of Arts in Economics from George Washington University.
More Economy in Brief


