 Global| Apr 06 2011
U.S. Loans Past Due Decline Sharply
by:Tom Moeller
|in:Economy in Brief
Summary
The American Bankers Association reported that the number of loans past due as a percentage of the number of loans outstanding fell sharply by the end of last year. In addition, based on loan values the figure also was down sharply [...]
The American Bankers Association reported that the number of loans past due as a percentage of the number of loans outstanding fell sharply by the end of last year. In addition, based on loan values the figure also was down sharply from its high. Nevertheless, the percentages remained up versus the beginning of the last recession.
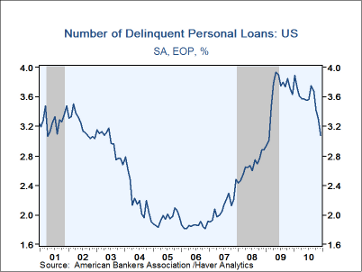
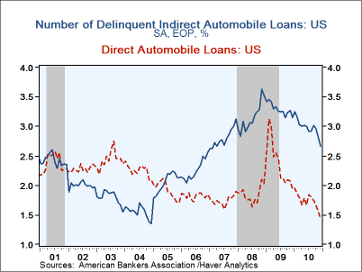
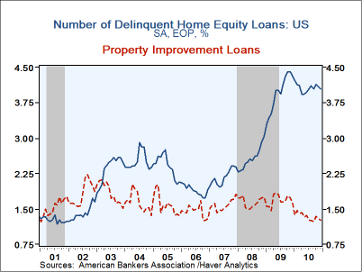
Delinquent direct auto loans fell to the lowest since 1995. Personal loan delinquencies also showed great improvement, falling to 3.08% from the peak 3.93% in early-2009. Delinquent home improvement loans also fell sharply to 1.26% from the recession peak of 1.85%. The latest was the lowest level since 2006. Holding near the recent high were delinquent home equity loans.
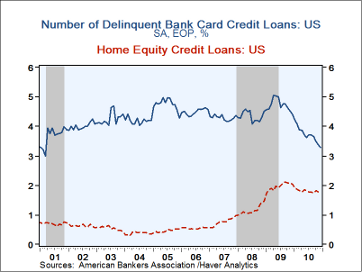
Delinquent open-end loans also fell sharply, led by the drop in bank-cards to 3.28% and non-card revolving credit to 0.87%, roughly half the recent high. Delinquent home-equity lines of credit also fell but only to 1.73% from the high of 2.12%.
The American Bankers Assn. figures can be found in Haver's DLINQ database.
The minutes to the latest FOMC meeting can be found here.
| Loans Past Due 30 or More Days as a % of Outstanding | Dec | Nov | Oct | 2010 | 2009 | 2008 |
|---|---|---|---|---|---|---|
| Closed-End Loan | ||||||
| Personal Loans | 3.08 | 3.30 | 3.42 | 3.08 | 3.63 | 2.88 |
| Automobile Loans | ||||||
| Direct From Bank | 1.44 | 1.55 | 1.65 | 1.44 | 1.94 | 2.03 |
| Indirect Through Dealer | 2.66 | 2.81 | 2.96 | 2.66 | 3.15 | 3.53 |
| Home Equity & Second Mortgages | 4.05 | 4.09 | 4.14 | 4.05 | 4.32 | 3.03 |
| Property Improvement | 1.26 | 1.30 | 1.34 | 1.26 | 1.63 | 1.75 |
| Open-End Loan | ||||||
| Home-equity | 1.73 | 1.77 | 1.81 | 1.73 | 2.04 | 1.46 |
| Bank card credit | 3.28 | 3.37 | 3.46 | 3.28 | 4.39 | 4.52 |
| Non-card revolving | 0.87 | 0.92 | 0.99 | 0.87 | 1.46 | 1.35 |
Tom Moeller
AuthorMore in Author Profile »Prior to joining Haver Analytics in 2000, Mr. Moeller worked as the Economist at Chancellor Capital Management from 1985 to 1999. There, he developed comprehensive economic forecasts and interpreted economic data for equity and fixed income portfolio managers. Also at Chancellor, Mr. Moeller worked as an equity analyst and was responsible for researching and rating companies in the economically sensitive automobile and housing industries for investment in Chancellor’s equity portfolio. Prior to joining Chancellor, Mr. Moeller was an Economist at Citibank from 1979 to 1984. He also analyzed pricing behavior in the metals industry for the Council on Wage and Price Stability in Washington, D.C. In 1999, Mr. Moeller received the award for most accurate forecast from the Forecasters' Club of New York. From 1990 to 1992 he was President of the New York Association for Business Economists. Mr. Moeller earned an M.B.A. in Finance from Fordham University, where he graduated in 1987. He holds a Bachelor of Arts in Economics from George Washington University.


