 Global| Sep 04 2003
U.S. Light Vehicle Sales Surged
by:Tom Moeller
|in:Economy in Brief
Summary
Light vehicle sales rose more than expected in August to a 19.0M unit annual rate. The 9.6% gain versus July contrasted with Consensus expectations for a m/m decline to 17.0M. Sales of light trucks were the standout last month rising [...]
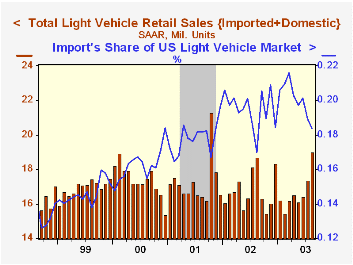
Light vehicle sales rose more than expected in August to a 19.0M unit annual rate. The 9.6% gain versus July contrasted with Consensus expectations for a m/m decline to 17.0M.
Sales of light trucks were the standout last month rising 12.8% m/m to a near-record selling rate of 10.75M units.
Car sales rose as well, up 5.7% for the third consecutive respectable monthly gain.
Sales of domestic light vehicles jumped 10.3% to a 15.5M unit selling rate on the strength of a 14.0% rise in light truck sales.
Imported vehicle sales rose a lesser 6.3% and captured 18.4% of the US market.
| Light Vehicle Sales (SAAR, Mil.Units) | Aug | July | Y/Y | 2002 | 2001 | 2000 |
|---|---|---|---|---|---|---|
| Total | 19.00 | 17.34 | 1.7% | 16.81 | 17.26 | 17.40 |
| Autos | 8.26 | 7.81 | -5.1% | 8.07 | 8.48 | 8.83 |
| Light Trucks | 10.75 | 9.53 | 7.7% | 8.74 | 8.78 | 8.56 |
by Tom Moeller September 4, 2003
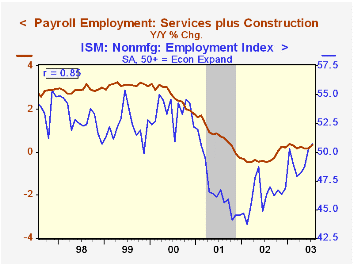
The Institute for Supply Management reported that the August index of activity in the nonmanufacturing sector was unchanged from July which was the highest level in the series' brief seven year history. At 65.1 the index beat Consensus expectations for a decline to 62.0.
The seasonally adjusted employment index improved to 51.0, the fourth month above 50 this year. Since the series' inception there has been an 85% correlation between the level of the ISM nonmanufacturing employment index and the y/y change in payroll employment in the service producing and construction industries.
The orders index improved to 67.6, a record high.Business activity for the nonmanufacturing sector is a question separate from the subgroups mentioned above. In contrast, the NAPM manufacturing sector composite index weights the components.
The seasonally adjusted prices index rose to 55.7, an improvement from the recession lows in the low 40s.
ISM surveys more than 370 purchasing managers in more than 62 industries including construction, law firms, hospitals, government and retailers. The nonmanufacturing survey dates only to July 1997, therefore its seasonal adjustment should be viewed tentatively.
| ISM Nonmanufacturing Survey | Aug | July | Y/Y | 2002 | 2001 | 2000 |
|---|---|---|---|---|---|---|
| Business Activity Index | 65.1 | 65.1 | 51.9 | 55.1 | 49.0 | 59.3 |
| Prices Index | 55.7 | 50.6 | 54.6 | 53.9 | 51.6 | 63.5 |
by Tom Moeller September 4, 2003
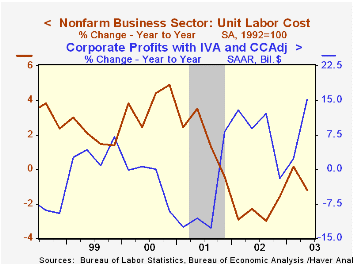
Nonfarm labor productivity growth last quarter was revised up to 6.8% from an already strong 5.7% reported last month. Consensus expectations had been for an upward revision to 6.2% growth.
The upward revision led to a revision of the initially reported 2.1% decline in unit labor costs to a 2.8% decline. It was the sixth decline in unit labor costs over the last eight quarters. During that period unit labor costs are down 3.5%. Compensation growth was revised up slightly for 2Q to a 3.8% rate.
The upward revision to productivity stemmed from an upward revision to output growth, now pegged at 4.4% (versus a preliminary 3.4%). That was accompanied by a 2.3% decline (about unrevised) in hours of all persons (employment times hours). Since peaking in three years ago, hours worked have fallen 5.5%.
Productivity in the nonfinancial corporate sector, a figure derived from the income side of the National Income & Product Accounts, surged at an 8.1% annual rate (4.8% y/y). That was the fastest rate of growth since 4Q 2001 and the second fastest growth rate since 1975. It drove down unit labor costs at a 3.8% rate (-1.1% y/y).
Manufacturing sector productivity growth in 2Q was revised down slightly to 3.7% (3.5% y/y). Unit labor costs rose 1.5% (0.8% y/y), revised up slightly.
| Nonfarm Business Sector (SAAR) | 2Q '03 Revised | 1Q '03 | Y/Y | 2002 | 2001 | 2000 |
|---|---|---|---|---|---|---|
| Output per Hour | 6.8% | 2.1% | 4.1% | 5.4% | 1.9% | 3.0% |
| Compensation | 3.8% | 4.1% | 2.9% | 2.8% | 3.6% | 7.0% |
| Unit Labor Costs | -2.8% | 2.0% | -1.2% | -2.4% | 1.7% | 3.9% |
by Tom Moeller September 4, 2003
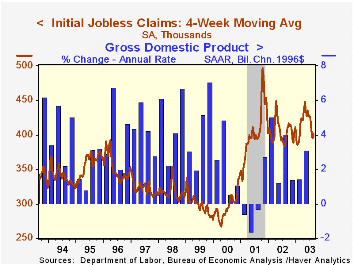
Initial claims for jobless insurance rose to 413,000 last week and the prior week's level was revised up slightly to 398,000. Consensus expectations had been for claims of 390,000.
The four-week moving average of initial claims rose to 401,500 (+0.9% y/y), the first time above the 400,000 threshold since late July.
Continuing claims for unemployment insurance rose by 24,000 for the third consecutive weekly gain but the prior week's gain was revised down to only 9,000.
The insured rate of unemployment held steady at 2.9% where it's been for six weeks.
| Unemployment Insurance (000s) | 8/30/03 | 8/23/03 | Y/Y | 2002 | 2001 | 2000 |
|---|---|---|---|---|---|---|
| Initial Claims | 413.0 | 398.0 | 2.0% | 404.3 | 406.0 | 299.7 |
| Continuing Claims | -- | 3,663 | 3.3% | 3,575 | 3,022 | 2,114 |
by Tom Moeller September 4, 2003
Factory orders jumped another 1.6% in July following a 1.9% pop in June. Strong orders for nondurable goods, up 2.4%, drove the gain. The rise reflected higher orders for petroleum products but also sharp gains in orders for chemicals & plastics. Durable goods orders rose 1.0%, unrevised from the advance report.
Nondurable goods orders equal shipments in this report on manufacturing sector activity.
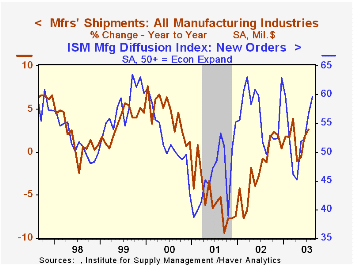
Manufacturing inventories fell 0.5% in July for the third consecutive monthly decline. Prior months' figures were revised. The ISM inventory index in August fell to 42.5 suggesting further decumulation last month.
Declines in inventories were widespread.
Factory shipments jumped 2.5% (1.6% y/y). Less the transportation sector shipments rose 2.2% (3.7% y/y. Shipments of computers and electronic products have been strong, up 7.3% y/y.
| Factory Survey (NAICS) | July | June | Y/Y | 2002 | 2001 | 2000 |
|---|---|---|---|---|---|---|
| Inventories | -0.5% | -0.3% | -0.5% | -1.8% | -6.1% | 3.8% |
| New Orders | 1.6% | 1.9% | 1.5% | -1.9% | -6.7% | 5.0% |
| Shipments | 2.5% | 1.5% | 2.6% | -2.0% | -5.4% | 4.2% |

Tom Moeller
AuthorMore in Author Profile »Prior to joining Haver Analytics in 2000, Mr. Moeller worked as the Economist at Chancellor Capital Management from 1985 to 1999. There, he developed comprehensive economic forecasts and interpreted economic data for equity and fixed income portfolio managers. Also at Chancellor, Mr. Moeller worked as an equity analyst and was responsible for researching and rating companies in the economically sensitive automobile and housing industries for investment in Chancellor’s equity portfolio. Prior to joining Chancellor, Mr. Moeller was an Economist at Citibank from 1979 to 1984. He also analyzed pricing behavior in the metals industry for the Council on Wage and Price Stability in Washington, D.C. In 1999, Mr. Moeller received the award for most accurate forecast from the Forecasters' Club of New York. From 1990 to 1992 he was President of the New York Association for Business Economists. Mr. Moeller earned an M.B.A. in Finance from Fordham University, where he graduated in 1987. He holds a Bachelor of Arts in Economics from George Washington University.
More Economy in Brief


