 Global| Oct 02 2008
U.S. Light Vehicle Sales Backpedal
by:Tom Moeller
|in:Economy in Brief
Summary
U.S. September sales of light vehicles reversed their August rise and fell 8.9%, according to the Autodata Corporation. The sales rate of 12.50M units fell back to its July level, which was the lowest sales rates since 1992. Sales for [...]
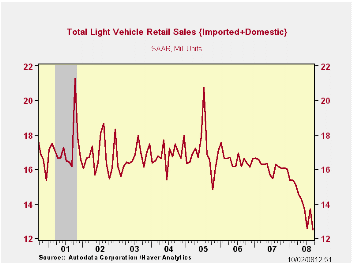
U.S. September sales of light vehicles reversed their August rise and fell 8.9%, according to the Autodata Corporation. The sales rate of 12.50M units fell back to its July level, which was the lowest sales rates since 1992. Sales for the year so far have averaged a 14.12M annual selling rate, down 12.8% from the first nine months of last year. The level of September vehicle sales was quite a bit weaker than Consensus expectations for sales of 13.5M.
Sales of domestically made light vehicles reversed half of their August gain and fell 8.3% (-23.4% y/y) to 9.44M units. Year-to-date, sales were down 14.8% from the first nine months of last year. Domestically made light truck sales continued to suffer due to higher gasoline prices, falling 11.8% (-28.1% y/y). That decline reversed nearly half of their 28.1% August gain. Truck sales this year were 21.1% lower than during the first nine months of 2007. Sales of U.S.- made cars fell a lesser 3.7% from August. Drivers' shift to purchases of relatively fuel efficient vehicles left sales down a less severe 5.9% versus the first nine months of last year.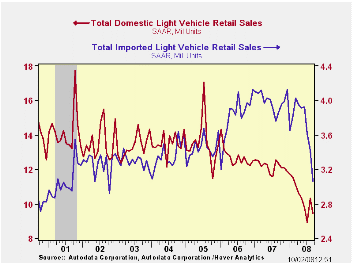
Import's share of the U.S. light vehicle market fell again, last month to 24.5%, the lowest since this past January. (Imported vehicles are those produced outside the U.S. and does not include vehicles with the nameplate of a foreign manufacturer produced within the U.S.).
Who really made your car? from the Federal Reserve Bank of Chicago is available here.
Economy in lower gear through 2008 also from the Federal Reserve Bank of Chicago can be found here.
| Light Vehicle Sales (SAAR, Mil. Units) | September | August | Y/Y | 2007 | 2006 | 2005 |
|---|---|---|---|---|---|---|
| Total | 12.50 | 13.72 | -22.8% | 16.17 | 16.54 | 16.96 |
| Autos | 6.19 | 6.74 | -17.2 | 7.58 | 7.77 | 7.65 |
| Domestic | 4.25 | 4.41 | -16.8 | 5.07 | 5.31 | 5.40 |
| Imported | 1.94 | 2.33 | -18.2 | 2.51 | 2.45 | 2.25 |
| Light Trucks | 6.31 | 6.98 | -27.6 | 8.60 | 8.78 | 9.32 |
| Domestic | 5.19 | 5.89 | -28.1 | 7.12 | 7.42 | 8.12 |
| Imported | 1.12 | 1.09 | -24.7 | 1.48 | 1.37 | 1.20 |

Tom Moeller
AuthorMore in Author Profile »Prior to joining Haver Analytics in 2000, Mr. Moeller worked as the Economist at Chancellor Capital Management from 1985 to 1999. There, he developed comprehensive economic forecasts and interpreted economic data for equity and fixed income portfolio managers. Also at Chancellor, Mr. Moeller worked as an equity analyst and was responsible for researching and rating companies in the economically sensitive automobile and housing industries for investment in Chancellor’s equity portfolio. Prior to joining Chancellor, Mr. Moeller was an Economist at Citibank from 1979 to 1984. He also analyzed pricing behavior in the metals industry for the Council on Wage and Price Stability in Washington, D.C. In 1999, Mr. Moeller received the award for most accurate forecast from the Forecasters' Club of New York. From 1990 to 1992 he was President of the New York Association for Business Economists. Mr. Moeller earned an M.B.A. in Finance from Fordham University, where he graduated in 1987. He holds a Bachelor of Arts in Economics from George Washington University.
More Economy in Brief


