 Global| Jan 26 2009
U.S. Leading Indicators Rose Slightly
by:Tom Moeller
|in:Economy in Brief
Summary
The Conference Board reported that the December composite index of leading economic indicators rose 0.3% after an unrevised 0.4% November decline. The peak for the index was in July of last year and the six-month percent change of [...]
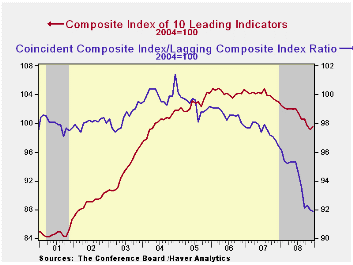
The Conference Board reported that the December composite index of leading economic indicators rose 0.3% after an unrevised 0.4% November decline. The peak for the index was in July of last year and the six-month percent change of -5.0% was near the largest rate of decline since 1990.
Five of the ten components of the leading index fell last month with the largest declines coming from lower building permits, shorter hours worked and easier vendor performance. Higher initial claims for jobless insurance also subtracted a sharp 0.15 percentage points from the leaders and consumer expectations were about unchanged. Faster money supply growth added back one percentage point to the m/m change in the leading index and a steeper yield curve added another 0.2 points.
The breadth of one-month increase amongst the leaders' 10 components improved to 50% but over a six-month period the breadth of gain amongst the components remained stuck at a quite low 30%.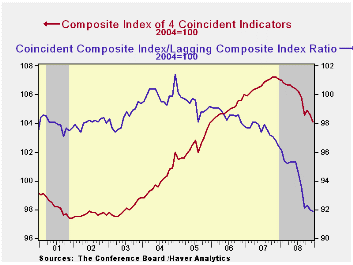
The leading index is based on actual reports for eight economic data series. The Conference Board initially estimates two series, orders for consumer goods and orders for capital goods.
The coincident indicators fell again. The 0.5% decline followed an unrevised 0.3% November drop an it was the tenth of the year. Three quarters of the index components fell m/m but over six months 25.0% rose. Year-to-year the coincident indicators fell 2.8% and over the last ten years there has been a 76% correlation between this y/y change and real GDP.
The lagging index fell 0.4% after no change in November. The ratio of coincident-to-lagging indicators (a measure of economic excess) fell slightly to its lowest level since 1975.Visit the Conference Board's site for coverage of leading indicator series from around the world.
| Business Cycle Indicators (%) | December | November | October | Sept. 6-Month % (AR) | 2008 | 2007 | 2006 |
|---|---|---|---|---|---|---|---|
| Leading | 0.3 | -0.4 | -1.0 | -5.0 | -2.7 | -0.3 | 1.5 |
| Coincident | -0.5 | -0.3 | 0.3 | -2.8 | -0.8 | 1.6 | 2.5 |
| Lagging | -0.4 | 0.0 | 0.1 | 2.9 | 2.8 | 2.8 | 3.3 |

Tom Moeller
AuthorMore in Author Profile »Prior to joining Haver Analytics in 2000, Mr. Moeller worked as the Economist at Chancellor Capital Management from 1985 to 1999. There, he developed comprehensive economic forecasts and interpreted economic data for equity and fixed income portfolio managers. Also at Chancellor, Mr. Moeller worked as an equity analyst and was responsible for researching and rating companies in the economically sensitive automobile and housing industries for investment in Chancellor’s equity portfolio. Prior to joining Chancellor, Mr. Moeller was an Economist at Citibank from 1979 to 1984. He also analyzed pricing behavior in the metals industry for the Council on Wage and Price Stability in Washington, D.C. In 1999, Mr. Moeller received the award for most accurate forecast from the Forecasters' Club of New York. From 1990 to 1992 he was President of the New York Association for Business Economists. Mr. Moeller earned an M.B.A. in Finance from Fordham University, where he graduated in 1987. He holds a Bachelor of Arts in Economics from George Washington University.


