 Global| Jul 20 2009
U.S. Leading Indicators Rise For A Third Month Signaling Economic Recovery
by:Tom Moeller
|in:Economy in Brief
Summary
The Conference Board's Index of Leading Economic Indicators continued to suggest a pending economic recovery. The June composite index of leaders rose another 0.7% after gains of 1.3% (upwardly revised) and 1.0% during the prior two [...]
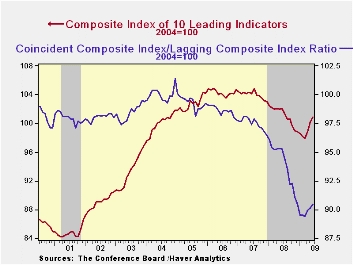
The Conference Board's Index of Leading Economic Indicators continued to suggest a pending economic recovery. The June composite index of leaders rose another 0.7% after gains of 1.3% (upwardly revised) and 1.0% during the prior two months. The combined 3.0% rise during those three months was the strongest since early 2002 while the index itself was at the highest level since last July. The leading index is based on actual reports for eight economic data series. The Conference Board initially estimates two series, orders for consumer goods and orders for capital goods.
For the third straight month, nearly three quarters of the ten components of the leading index increased with the largest positive contributions coming from a steeper yield curve, higher building permits and higher stock prices. The money supply and consumer expectations made slight negative contributions.
Again suggesting that the rate of decline in the economy is slowing were the coincident indicators. They fell 0.2%, about as they have for three consecutive months. These compare with monthly declines of 0.6%-to-1.1% dating back to September. The negative contributions from lower employment and production have eased. The remaining two component series actually rose during June, led by very slight gains in real disposable income and business sales. Over the last ten years there has been a 76% correlation between this y/y change and real GDP.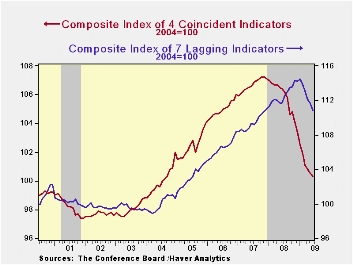
World Economic Outlook Update; Contractionary Forces Receding But Weak Recovery Ahead from the international Monetary Fund can be found here.
| Business Cycle Indicators (%) | June | May | April | March 6-Month % (AR) | 2008 | 2007 | 2006 |
|---|---|---|---|---|---|---|---|
| Leading | 0.7 | 1.3 | 1.0 | 4.1 | -2.8 | -0.3 | 1.5 |
| Coincident | -0.2 | -0.3 | -0.7 | -5.9 | -0.8 | 1.6 | 2.5 |
| Lagging | -0.2 | -0.8 | -0.6 | -5.9 | 2.9 | 2.8 | 3.3 |

Tom Moeller
AuthorMore in Author Profile »Prior to joining Haver Analytics in 2000, Mr. Moeller worked as the Economist at Chancellor Capital Management from 1985 to 1999. There, he developed comprehensive economic forecasts and interpreted economic data for equity and fixed income portfolio managers. Also at Chancellor, Mr. Moeller worked as an equity analyst and was responsible for researching and rating companies in the economically sensitive automobile and housing industries for investment in Chancellor’s equity portfolio. Prior to joining Chancellor, Mr. Moeller was an Economist at Citibank from 1979 to 1984. He also analyzed pricing behavior in the metals industry for the Council on Wage and Price Stability in Washington, D.C. In 1999, Mr. Moeller received the award for most accurate forecast from the Forecasters' Club of New York. From 1990 to 1992 he was President of the New York Association for Business Economists. Mr. Moeller earned an M.B.A. in Finance from Fordham University, where he graduated in 1987. He holds a Bachelor of Arts in Economics from George Washington University.
More Economy in Brief


