 Global| Sep 18 2008
U.S. Leading Indicators Fell Again
by:Tom Moeller
|in:Economy in Brief
Summary
The composite index of leading economic indicators, reported by the Conference Board fell 0.5% last month after an unrevised decline of 0.7% in July. The decline left the six-month percent change at -2.1% which was modestly improved [...]
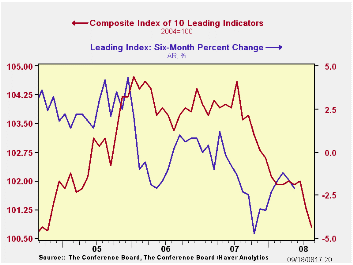
The composite index of leading economic indicators, reported by the Conference Board fell 0.5% last month after an unrevised decline of 0.7% in July. The decline left the six-month percent change at -2.1% which was modestly improved from a -4.7% figure last October.
Last month lower building permits, lower vendor performance and higher claims for unemployment insurance made the largest negative contributions to the index decline. These were partially offset by a steepening of the yield curve (10-year Treasury yield vs. Fed funds rate) and improvement in the University of Michigan index of consumer expectations.
The breadth of one-month increase amongst the leaders' 10 components remained low at 40%. Over a six-month period the breadth of gain amongst the leaders' components fell back to its cycle low of 20%.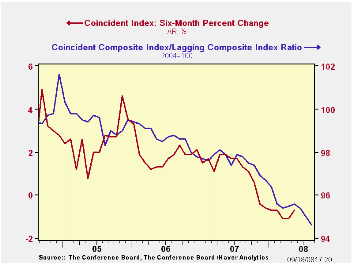
The leading index is based on actual reports for eight economic data series. The Conference Board initially estimates two series, orders for consumer goods and orders for capital goods.
The coincident indicators fell 0.1% after a revised no change during July. Half of the components rose and half fell, but over six months only a quarter are up. Over the last ten years there has been an 86% correlation between the y/y changes in the coincident indicators and real GDP.
The lagging index repeated its increase and rose 0.4%. The ratio of coincident to lagging indicators (a measure of economic excess) declined to its lowest level since 1982.Visit the Conference Board's site for coverage of leading indicator series from around the world.
Banking Crisis Solutions Old and New from the Federal Reserve Bank of St. Louis can be found here.
| Business Cycle Indicators | August | July | June | May, 6 Month % (AR) | 2007 | 2006 | 2005 |
|---|---|---|---|---|---|---|---|
| Leading | -0.5% | -0.7% | 0.1% | -2.1% | -0.4% | 1.3% | 2.7% |
| Coincident | -0.1 | 0.0 | -0.2 | -0.7 | 1.7% | 2.4% | 2.5% |
| Lagging | 0.4 | 0.4 | 0.0 | 1.4 | 2.9% | 3.1% | 3.1% |

Tom Moeller
AuthorMore in Author Profile »Prior to joining Haver Analytics in 2000, Mr. Moeller worked as the Economist at Chancellor Capital Management from 1985 to 1999. There, he developed comprehensive economic forecasts and interpreted economic data for equity and fixed income portfolio managers. Also at Chancellor, Mr. Moeller worked as an equity analyst and was responsible for researching and rating companies in the economically sensitive automobile and housing industries for investment in Chancellor’s equity portfolio. Prior to joining Chancellor, Mr. Moeller was an Economist at Citibank from 1979 to 1984. He also analyzed pricing behavior in the metals industry for the Council on Wage and Price Stability in Washington, D.C. In 1999, Mr. Moeller received the award for most accurate forecast from the Forecasters' Club of New York. From 1990 to 1992 he was President of the New York Association for Business Economists. Mr. Moeller earned an M.B.A. in Finance from Fordham University, where he graduated in 1987. He holds a Bachelor of Arts in Economics from George Washington University.
More Economy in Brief


