 Global| Feb 18 2010
U.S. Leading Economic Indicators Suggest Continued Recovery
by:Tom Moeller
|in:Economy in Brief
Summary
The uptrend in the Conference Board's Index of Leading Economic Indicators continued last month though it lost a little steam. The rise of 0.3% followed stronger monthly gains dating back to April and the six-month rate of increase at [...]
 The uptrend
in the Conference Board's Index of Leading Economic Indicators
continued last month though it lost a little steam. The rise of 0.3%
followed stronger monthly gains dating back to April and the six-month
rate of increase at 9.8% (centered) was its weakest since May. The
leading index is based on actual reports for eight economic data
series. The Conference Board initially estimates two series, consumer
and capital goods orders.
The uptrend
in the Conference Board's Index of Leading Economic Indicators
continued last month though it lost a little steam. The rise of 0.3%
followed stronger monthly gains dating back to April and the six-month
rate of increase at 9.8% (centered) was its weakest since May. The
leading index is based on actual reports for eight economic data
series. The Conference Board initially estimates two series, consumer
and capital goods orders.
The breadth of increase amongst the component series slipped last month to its lowest since last March. Barely half of the ten components rose during January versus all of them during December. During the most recent six months, however, a stable 80% of the series rose. Prominent in last month's increase was a steeper interest rate yield curve, vendor performance and weekly hours.
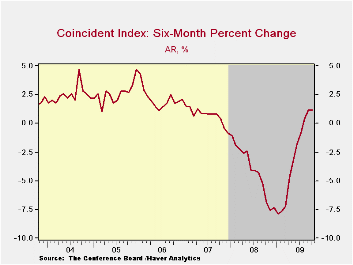
Continuing to suggest economic improvement was the coincident indicator series which rose 0.2%. The gain lifted the six-month change to 1.2%, up from -7.9% at its worst in January of last year. Increases in industrial production, real personal income and business sales have been modest but compare to sharp declines late in 2008. Declines in payroll employment also have eased considerably.
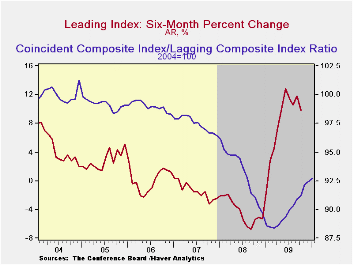
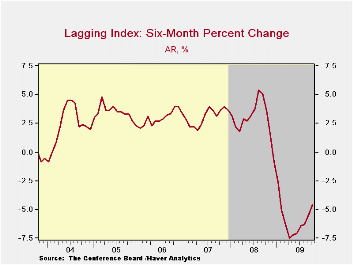
In a continued sign that excesses in the U.S. economy are still falling, the lagging index continues to drop as it has for a year. Leading the decline have been shortened duration of unemployment, lower commercial & industrial loans outstanding and retrenchment in consumer credit. The ratio of coincident-to-lagging indicators (another leading indicator) also continued higher for the tenth straight month to the highest level since September of 2008.
The Conference Board figures are available in Haver's BCI database. Visit the Conference Board's site for coverage of leading indicator series from around the world. The latest U.S. Leading Indicators release can be found here here.
| Business Cycle Indicators (%) | January | December | November | Oct. 6-Month % (AR) | 2009 | 2008 | 2007 |
|---|---|---|---|---|---|---|---|
| Leading | 0.3 | 1.2 | 1.1 | 9.8 | 0.4 | -2.8 | -0.4 |
| Coincident | 0.2 | 0.0 | 0.3 | 1.2 | -5.1 | -1.2 | 1.4 |
| Lagging | -0.1 | -0.3 | -0.7 | -4.6 | -1.6 | 3.2 | 3.0 |

Tom Moeller
AuthorMore in Author Profile »Prior to joining Haver Analytics in 2000, Mr. Moeller worked as the Economist at Chancellor Capital Management from 1985 to 1999. There, he developed comprehensive economic forecasts and interpreted economic data for equity and fixed income portfolio managers. Also at Chancellor, Mr. Moeller worked as an equity analyst and was responsible for researching and rating companies in the economically sensitive automobile and housing industries for investment in Chancellor’s equity portfolio. Prior to joining Chancellor, Mr. Moeller was an Economist at Citibank from 1979 to 1984. He also analyzed pricing behavior in the metals industry for the Council on Wage and Price Stability in Washington, D.C. In 1999, Mr. Moeller received the award for most accurate forecast from the Forecasters' Club of New York. From 1990 to 1992 he was President of the New York Association for Business Economists. Mr. Moeller earned an M.B.A. in Finance from Fordham University, where he graduated in 1987. He holds a Bachelor of Arts in Economics from George Washington University.
More Economy in Brief


