 Global| Jan 22 2010
U.S. Leading Economic Indicators Suggest Continued Recovery
by:Tom Moeller
|in:Economy in Brief
Summary
The firm uptrend in the Conference Board's Index of Leading Economic Indicators continued last month with a rise of 1.1% following an upwardly revised like gain in November. It was the ninth consecutive monthly increase and the 10.8% [...]
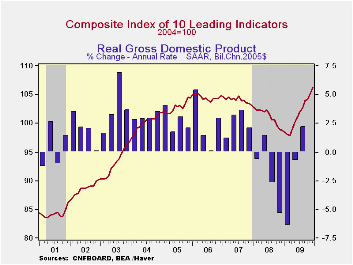
The firm uptrend in the Conference Board's Index of Leading Economic Indicators continued last month with a rise of 1.1% following an upwardly revised like gain in November. It was the ninth consecutive monthly increase and the 10.8% (centered) rate of increase during the last six months remained nearly the strongest since early-1983. The leading index is based on actual reports for eight economic data series. The Conference Board initially estimates two series, consumer and capital goods orders.
The leaders' increase supports widespread forecasts for a 4.5% (AR) gain in 4Q 2009 real GDP. The preliminary figures will be released this coming Friday.
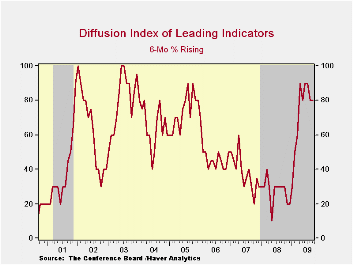
The breadth of increase amongst the component series improved last month back to the strongest percentage of the cycle. Nine out of the ten components rose during December versus 70% during the prior two months. During the most recent six months, however, just 80% of the series rose. Prominent in last month's increase was a steeper interest rate yield curve, higher building permits and lower initial claims for unemployment insurance.
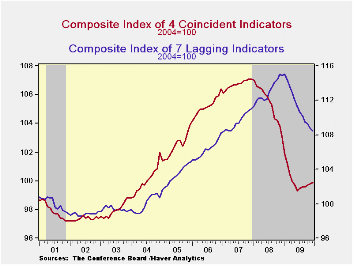
Continuing to suggest economic improvement was the coincident indicator series which rose for the fifth month in the last six. The 0.1% December gain followed a 0.1% November increase that was revised down slightly. During the last six months the 1.2% rate of increase in the coincident series compares to a -7.9% reading at its worst in January. Increases in industrial production, real personal income and business sales have been modest but compare to sharp declines late in 2008. Declines in payroll employment also have eased considerably.
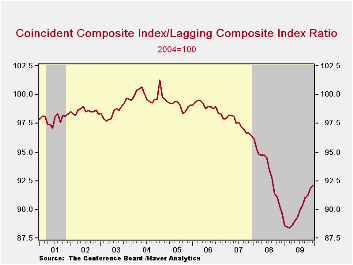
In a continued sign that excesses in the U.S. economy are still falling, the lagging index has been falling since January. Leading the decline have been lower commercial & industrial loans outstanding, slower growth in labor costs, less consumer credit and slower service price inflation. The ratio of coincident-to-lagging indicators (another leading indicator) also continued higher for the ninth straight month to the highest level since August of 2008.
The Conference Board figures are available in Haver's BCI database. Visit the Conference Board's site for coverage of leading indicator series from around the world. The latest U.S. Leading Indicators release can be found here here.
| Business Cycle Indicators (%) | December | November | October | Sept. 6-Month % (AR) | 2009 | 2008 | 2007 |
|---|---|---|---|---|---|---|---|
| Leading | 1.1 | 1.0 | 0.3 | 10.8 | 0.4 | -2.8 | -0.4 |
| Coincident | 0.1 | 0.1 | 0.1 | 1.2 | -5.1 | -1.2 | 1.4 |
| Lagging | -0.2 | -0.5 | -0.2 | -4.8 | -1.6 | 3.2 | 3.0 |

Tom Moeller
AuthorMore in Author Profile »Prior to joining Haver Analytics in 2000, Mr. Moeller worked as the Economist at Chancellor Capital Management from 1985 to 1999. There, he developed comprehensive economic forecasts and interpreted economic data for equity and fixed income portfolio managers. Also at Chancellor, Mr. Moeller worked as an equity analyst and was responsible for researching and rating companies in the economically sensitive automobile and housing industries for investment in Chancellor’s equity portfolio. Prior to joining Chancellor, Mr. Moeller was an Economist at Citibank from 1979 to 1984. He also analyzed pricing behavior in the metals industry for the Council on Wage and Price Stability in Washington, D.C. In 1999, Mr. Moeller received the award for most accurate forecast from the Forecasters' Club of New York. From 1990 to 1992 he was President of the New York Association for Business Economists. Mr. Moeller earned an M.B.A. in Finance from Fordham University, where he graduated in 1987. He holds a Bachelor of Arts in Economics from George Washington University.
More Economy in Brief


