 Global| Aug 09 2011
U.S. Labor Productivity Growth Is Negative, Again
by:Tom Moeller
|in:Economy in Brief
Summary
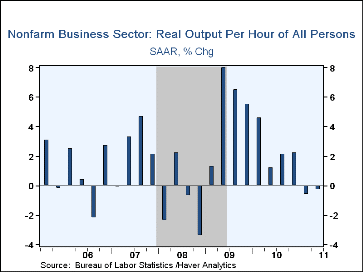
The economic slowdown took a further toll on worker productivity last quarter. Labor productivity in the nonfarm business sector slipped 0.3% (AR) after a similar 0.6% decline during Q1. The declines compare to 8% quarterly growth at [...]
The economic slowdown took a further toll on worker productivity last quarter. Labor productivity in the nonfarm business sector slipped 0.3% (AR) after a similar 0.6% decline during Q1. The declines compare to 8% quarterly growth at the end of the last recession. (Revisions to the data reflect the latest benchmark revisions to the GDP accounts.) Productivity is calculated by dividing an index of real output by an index of hours worked by all persons. And when output growth slows, as it has, and hours worked improves as it has, productivity suffers. During Q2, real output rose at a modest 1.8% rate (2.5% y/y), while hours worked rose an improved 2.0% (1.6% y/y).
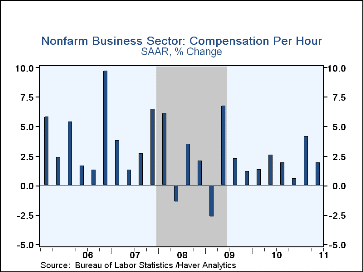
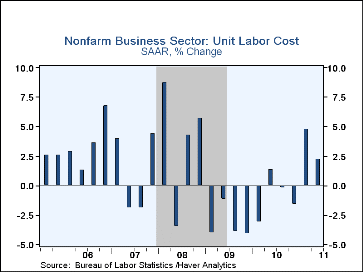
Accompanying the slow productivity growth was, not surprisingly, a slowdown in compensation. The 1.9% q/q increase was half that in Q1 and left the y/y change roughly stable at 2.1%. Together, the productivity and compensation figures raised unit labor costs at a 2.2% rate. The figure was up from the declines of 2010 and 2009.
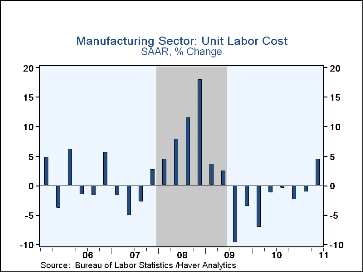
Factory sector productivity also suffered the effects of slower output growth last quarter. In fact, productivity declined for the first time since Q1 2009 due to a negligible 0.6% increase in output (4.4% y/y) while hours worked rose 2.6% (2.1% y/y). As compensation costs rose at a stable 2.3% rate, unit labor costs jumped 4.4%, the strongest gain since Q4 2008.
The productivity & cost figures are available in Haver's USECON database.
Evaluating the role of labor market mismatch in rising unemployment from the Federal Reserve Bank of Chicago is available here.
| Productivity & Costs (SAAR,%) | Q2'11 | Q1'11 | Q4'10 | Q2 Y/Y | 2010 | 2009 | 2008 |
|---|---|---|---|---|---|---|---|
| Nonfarm Business Sector | |||||||
| Output per Hour (Productivity) | -0.3 | -0.6 | 2.2 | 0.8 | 4.1 | 2.3 | 0.6 |
| Compensation per Hour | 1.9 | 4.2 | 0.6 | 2.1 | 1.6 | 3.4 | |
| Unit Labor Costs | 2.2 | 4.8 | -1.6 | 1.3 | -2.0 | -0.7 | 2.8 |
| Manufacturing Sector | |||||||
| Output per Hour | -2.0 | 4.2 | 4.9 | 2.3 | 5.9 | -0.4 | -0.4 |
| Compensation per Hour | 2.3 | 3.1 | 2.3 | 2.3 | 1.6 | 4.5 | 4.3 |
| Unit Labor Costs | 4.4 | -1.1 | -2.5 | 0.0 | -4.0 | 4.9 | 4.7 |
Tom Moeller
AuthorMore in Author Profile »Prior to joining Haver Analytics in 2000, Mr. Moeller worked as the Economist at Chancellor Capital Management from 1985 to 1999. There, he developed comprehensive economic forecasts and interpreted economic data for equity and fixed income portfolio managers. Also at Chancellor, Mr. Moeller worked as an equity analyst and was responsible for researching and rating companies in the economically sensitive automobile and housing industries for investment in Chancellor’s equity portfolio. Prior to joining Chancellor, Mr. Moeller was an Economist at Citibank from 1979 to 1984. He also analyzed pricing behavior in the metals industry for the Council on Wage and Price Stability in Washington, D.C. In 1999, Mr. Moeller received the award for most accurate forecast from the Forecasters' Club of New York. From 1990 to 1992 he was President of the New York Association for Business Economists. Mr. Moeller earned an M.B.A. in Finance from Fordham University, where he graduated in 1987. He holds a Bachelor of Arts in Economics from George Washington University.
More Economy in Brief
 Global| Feb 05 2026
Charts of the Week: Balanced Policy, Resilient Data and AI Narratives
by:Andrew Cates


