 Global| Jun 06 2008
U.S. Jobless Rate of 5.5% Highest Since 2004, Payrolls Fell A Fifth Month
by:Tom Moeller
|in:Economy in Brief
Summary
From the Bureau of Labor Statistics household sector survey, the unemployment rate surged to 5.5% in May from an April level of 5.0%. A level of 5.1% had been expected. The increase owed to a 285,000 worker decline in employment which [...]
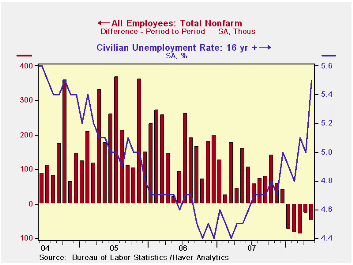
From the Bureau of Labor Statistics household sector survey, the unemployment rate surged to 5.5% in May from an April level of 5.0%. A level of 5.1% had been expected. The increase owed to a 285,000 worker decline in employment which unwound most of a 362,000 advance during April. During the last three months this measure of employment has risen at a 0.1% annual rate. The level of the unemployed, however, shot up at a 74.8% rate over the last three months.
The May employment decline had an inordinate effect in lifting the unemployment rate since the labor force surged by 577,000 (1.2% y/y), its firmest rise since last September. The increase was driven by a rise in the labor force participation rate, perhaps due to seasonal patterns, to 66.2% which was the highest level since March of last year.
The average duration of unemployment slipped to 16.6 weeks from 16.9 in April. Those figures are down from the averages of the prior several years.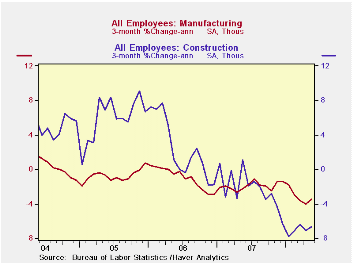
From the establishment survey nonfarm payrolls fell 49,000, the fifth consecutive monthly drop. The decline compared to expectations for a 60,000 worker decline. During the last three months payrolls fell at a 0.5% annual rate. That compared to a rate of decline in excess of 2.0% by the end of the last recession.
So far in the second quarter, the level of aggregate hours worked (employment multiplied by hours worked) is down at a 0.9% rate from 1Q. With 2% growth in productivity, that suggests 1% growth in real GDP.
Factory sector jobs fell 26,000 and at 3.5% rate over the last three months. That remained near the fastest rate of decline since 2003 but during the 2001 recession employment dropped at a 10% rate.
Construction sector employment fell hard again by 34,000 in May. Here the rate of job loss has been exceptionally large. The 6.6% rate of decline during the last three months has been in place since December and it rivals the worst rate of job loss in the construction sector since 1991.
Hiring in the service sector also slackened. An 8,000 increase in May payrolls followed a downwardly revised 72,000 April rise. The 0.2% rate of gain during the last three months compares to 1.6% to 1.8% growth during the last three years.
Private service sector hiring weakened even more dramatically to a 0.1% three-month growth rate from 1.5% to 2.1% growth during the prior four years. Job loss in the retail sector has led the weakness with a 2.4% 3-month rate of decline. Jobs in the information sector also have been falling at a 1.6% rate, about the same rate of decline as in the professional & business services sector. These declines have been offset by 4.4% growth in the number of jobs in education and 3.3% growth health care jobs. The number of finance sector jobs has been unchanged for three months while temporary help services jobs, often a leading indicator of employment growth, have been declining at a 10.9% rate. Real estate sector jobs also have been unchanged for three months, an improvement from a 4% rate of decline earlier this year.
Government sector jobs rose 17,000 and has increased at a 0.8% rate during the last three months. Local government hiring has been strongest and is up at a 1.1% since February.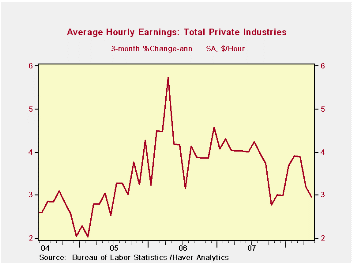
The one month diffusion index, which measures the breadth of job gain or loss (50 is the break-even level) continued to portend further job loss as it stood at 45.4%. The three- month index remained even weaker at 44.9%. The three-month figure for the factory sector was an abysmal 24.4%.
Average hourly earnings increased a modest 0.3% and three-month growth slipped to 3.0% after 4.0% growth during 2006 and 2007. Factory sector earnings rose 2.4% y/y while private service sector earnings rose 3.7% y/y.
Financial Market Developments and Credit Conditions is today's speech by Fed Governor Randall S. Kroszner and it can be found here.
| Employment: 000s | May | April | March | Y/Y | 2007 | 2006 | 2005 |
|---|---|---|---|---|---|---|---|
| Payroll Employment | -49 | -28 | -88 | 0.2% | 1.1% | 1.8% | 1.7% |
| Previous | -- | -20 | -81 | -- | 1.3% | 1.9% | 1.7% |
| Manufacturing | -26 | -49 | -46 | -2.5% | -1.9% | -0.5% | -0.6% |
| Construction | -34 | -52 | -39 | -5.1% | -1.0% | 4.9% | 5.2% |
| Average Weekly Hours | 33.7 | 33.7 | 33.8 | 33.8 (May '07) | 33.8 | 33.9 | 33.8 |
| Average Hourly Earnings | 0.3 | 0.1% | 0.3% | 3.5% | 4.0% | 3.9% | 2.7% |
| Unemployment Rate | 5.5% | 5.0% | 5.1% | 4.5% (May '07) | 4.6% | 4.6% | 5.1% |

Tom Moeller
AuthorMore in Author Profile »Prior to joining Haver Analytics in 2000, Mr. Moeller worked as the Economist at Chancellor Capital Management from 1985 to 1999. There, he developed comprehensive economic forecasts and interpreted economic data for equity and fixed income portfolio managers. Also at Chancellor, Mr. Moeller worked as an equity analyst and was responsible for researching and rating companies in the economically sensitive automobile and housing industries for investment in Chancellor’s equity portfolio. Prior to joining Chancellor, Mr. Moeller was an Economist at Citibank from 1979 to 1984. He also analyzed pricing behavior in the metals industry for the Council on Wage and Price Stability in Washington, D.C. In 1999, Mr. Moeller received the award for most accurate forecast from the Forecasters' Club of New York. From 1990 to 1992 he was President of the New York Association for Business Economists. Mr. Moeller earned an M.B.A. in Finance from Fordham University, where he graduated in 1987. He holds a Bachelor of Arts in Economics from George Washington University.
More Economy in Brief


