 Global| Sep 03 2004
U.S. Job Growth Recovered Some, Unemployment Rate Fell
by:Tom Moeller
|in:Economy in Brief
Summary
Nonfarm payrolls grew 144,000 last month following upwardly revised gains in both July & June which averaged 84,500 each month. Consensus expectations had been for a 150,000 job gain in August. The fall in the unemployment rate to [...]
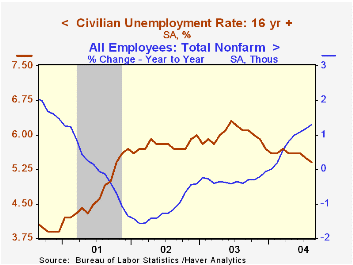
Nonfarm payrolls grew 144,000 last month following upwardly revised gains in both July & June which averaged 84,500 each month. Consensus expectations had been for a 150,000 job gain in August.
The fall in the unemployment rate to 5.4% from the separate household survey continued to suggest moderate labor market improvement. Employment growth eased to 21,000 (1.4% y/y) following a 629,000 rise the prior month and the labor force fell 152,000 (+0.7% y/y). The labor force participation rate slipped back to 66.0% from 66.2% in July.
Hiring in private service producing industries recovered modestly last month with an 84,000 (1.7% y/y) gain versus an upwardly revised 45,000 July rise, however, these gains are a fraction of the growth during the prior several months. Hiring in the financial sector did recover 18,000 m/m (0.8% y/y), but jobs in information services fell 10,000 (-0.3% y/y) and another 11,300 (+0.8% y/y) retailing jobs were lost. Hiring in professional & business services grew 32,000 (3.4% y/y) and temporary help services jobs rose 9,800 (8.9% y/y).
Factory sector payrolls grew 22,000 (0.1% y/y) following a downwardly revised gain in July. Construction sector hiring grew 15,000 (2.8% y/y).
The breadth of increase amongst private non-farm payrolls confirmed modest job growth at 54.5% versus an upwardly revised 54.9 in July. The three month diffusion index of hiring fell to 57.9 versus a high of 74.5 in May.
The index of aggregate hours worked (employment times hours worked) grew 0.2% following an upwardly revised 0.7% July rise. The index so far in the third quarter is 2.8% (AR) above 2Q which rose a revised 2.2% (AR) versus 1Q.
Average hourly earnings rose 0.3% (2.3% y/y) following an upwardly revised 0.4% July gain.
| Employment | Aug | July | Y/Y | 2003 | 2002 | 2001 |
|---|---|---|---|---|---|---|
| Payroll Employment | 144,000 | 73,000 | 1.3% | -0.3% | -1.1% | 0.0% |
| Manufacturing | 22,000 | 6,000 | 0.1% | -4.8% | -7.2% | -4.8% |
| Average Weekly Hours | 33.8 | 33.8 | 33.6 | 33.7 | 33.8 | 34.0 |
| Average Hourly Earnings | 0.3% | 0.4% | 2.3% | 2.7% | 2.9% | 3.8% |
| Unemployment Rate | 5.4% | 5.5% | 6.1% | 6.0% | 5.8% | 4.8% |
by Tom Moeller September 3, 2004
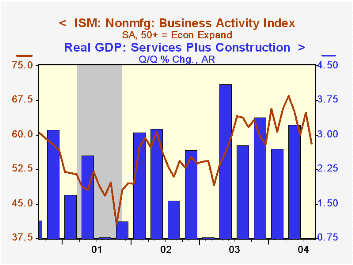
The Business Activity Index for the non-manufacturing sector from the Institute for Supply Management slipped to 58.2 in August from 64.9 in July. Consensus expectations had been for a more moderate decline to 63.0.
Since the series' inception in 1997 there has been a 60% correlation between the Business Activity Index and the q/q change in GDP services plus construction.
Despite the decline in the Business Index, the employment index recovered 2.5 points of the sharp 7.4 point July drop. Higher employment was reported by the same 18% of firms as in July. Since the series' inception in 1997 there has been a 61% correlation between the level of the ISM non-manufacturing employment index and the m/m change in payroll employment in the service producing plus the construction industries.
The new orders index slipped to 58.6 from the record high of 66.4 in July.Business Activity Index for the non-manufacturing sector reflects a question separate from the subgroups mentioned above. In contrast, the NAPM manufacturing sector composite index is a weighted average five components.
The seasonally adjusted prices index fell to 70.0 versus 73.1 in July and the record high of 74.6 sin June.
ISM surveys more than 370 purchasing managers in more than 62 industries including construction, law firms, hospitals, government and retailers. The non-manufacturing survey dates only to July 1997, therefore its seasonal adjustment should be viewed tentatively.
| ISM Nonmanufacturing Survey | Aug | July | Aug '03 | 2003 | 2002 | 2001 |
|---|---|---|---|---|---|---|
| Business Activity Index | 58.2 | 64.8 | 63.8 | 58.1 | 55.1 | 48.9 |
| Prices Index | 70.0 | 73.1 | 56.2 | 56.7 | 53.9 | 51.5 |

Tom Moeller
AuthorMore in Author Profile »Prior to joining Haver Analytics in 2000, Mr. Moeller worked as the Economist at Chancellor Capital Management from 1985 to 1999. There, he developed comprehensive economic forecasts and interpreted economic data for equity and fixed income portfolio managers. Also at Chancellor, Mr. Moeller worked as an equity analyst and was responsible for researching and rating companies in the economically sensitive automobile and housing industries for investment in Chancellor’s equity portfolio. Prior to joining Chancellor, Mr. Moeller was an Economist at Citibank from 1979 to 1984. He also analyzed pricing behavior in the metals industry for the Council on Wage and Price Stability in Washington, D.C. In 1999, Mr. Moeller received the award for most accurate forecast from the Forecasters' Club of New York. From 1990 to 1992 he was President of the New York Association for Business Economists. Mr. Moeller earned an M.B.A. in Finance from Fordham University, where he graduated in 1987. He holds a Bachelor of Arts in Economics from George Washington University.
More Economy in Brief


