 Global| Dec 03 2004
U.S. Job Growth Disappointing in November
by:Tom Moeller
|in:Economy in Brief
Summary
In November, non-farm payrolls rose just 112,000 following an October rise of 303,000 that was revised down from the initial report of a 337,000 gain. Consensus expectations had been for a 200,000 gain. Much of last month's weakness [...]
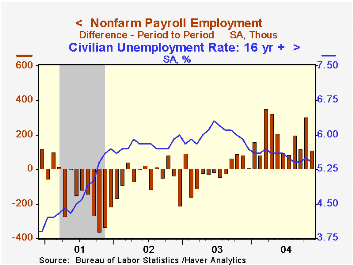
In November, non-farm payrolls rose just 112,000 following an October rise of 303,000 that was revised down from the initial report of a 337,000 gain. Consensus expectations had been for a 200,000 gain.
Much of last month's weakness centered in the service sector where government employment rose just 8,000. That was down from gains which ranged between 24,000 and 57,000 during the prior four months.
Hiring in private service producing industries also slackened somewhat, up 96,000 (1.8% y/y) following a downwardly revised 217,000 October rise. Retail jobs fell 16,2000 (+0.7% y/y) continuing a recent pattern of up one month-down the next month. Hiring in professional & business services rose 28,000 (3.5% y/y) following an outsized 100,000 gain in October. The gain in temporary help services jobs scaled back to 8,900 (10.4% y/y) after rising 50,800 in October. Jobs in the financial sector rose 12,000 m/m (1.5% y/y) and education & health services jobs rose 31,000 (2.2% y/y).
Factory sector payrolls fell 5,000, down for the third straight month; reflecting declines in the computer (+0.7% y/y), transportation equipment (+0.2% y/y), apparel (-7.4% y/y) and paper (-1.0% y/y) industries.
"Ricardo versus Wicksell on Job Losses and Technological Change" from the Federal Reserve Bank of Richmond can be found here.
The index of aggregate hours worked (employment times hours worked) fell 0.2% (+1.9% y/y) following a 0.3% October rise. The index is up at a 1.6% annual rate in the fourth quarter following 3.1% growth in 3Q.
Average hourly earnings rose a modest 0.1% (2.2% y/y) last month. Growth during the past year has been paced by a 3.1% gain in education & health services and a 2.6% gain in financial activities.
The unemployment rate from the separate household survey fell to 5.4%. Employment rose 483,000 (1.2% y/y) and the labor force grew 439,000 (0.7% y/y). The labor force participation rate rose sharply to 66.1%, near the highs of the year.
"The Logic of Monetary Policy," remarks made by Federal Reserve Board Governor Ben S. Bernanke are available here.
| Employment | Nov | Oct | Y/Y | 2003 | 2002 | 2001 |
|---|---|---|---|---|---|---|
| Payroll Employment | 112,000 | 303,000 | 1.6% | -0.3% | -1.1% | 0.0% |
| Manufacturing | -5,000 | -2,000 | 0.4% | -4.8% | -7.2% | -4.8% |
| Average Weekly Hours | 33.7 | 33.8 | 33.8 | 33.7 | 33.8 | 34.0 |
| Average Hourly Earnings | 0.1% | 0.3% | 2.2% | 2.7% | 2.9% | 3.8% |
| Unemployment Rate | 5.4% | 5.5% | 5.9% | 6.0% | 5.8% | 4.8% |
by Tom Moeller December 3, 2004
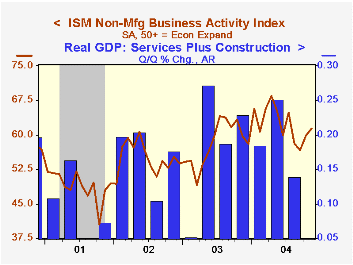
The November Business Activity Index for the non-manufacturing sector rose to 61.3, adding 1.5 points to the 3.1 point gain in October, according to the Institute for Supply Management. Consensus expectations had been for a modest decline to 58.5.
Since the series' inception in 1997 there has been a 55% correlation between the Business Activity Index and the q/q change in GDP services plus construction.
The employment sub index fell modestly to 55.0 following three months of gain. Since the series' inception in 1997 there has been a 60% correlation between the level of the ISM non-manufacturing employment index and the m/m change in payroll employment in the service producing plus the construction industries.
The new orders index fell for the third month in the last four.
ISM surveys more than 370 purchasing managers in more than 62 industries including construction, law firms, hospitals, government and retailers. The non-manufacturing survey dates only to July 1997, therefore its seasonal adjustment should be viewed tentatively.Business Activity Index for the non-manufacturing sector reflects a question separate from the subgroups mentioned above. In contrast, the NAPM manufacturing sector composite index is a weighted average five components.
| ISM Nonmanufacturing Survey | Nov | Oct | Nov '03 | 2003 | 2002 | 2001 |
|---|---|---|---|---|---|---|
| Business Activity Index | 61.3 | 59.8 | 59.6 | 58.1 | 55.1 | 48.9 |
| Prices Index | 71.0 | 74.1 | 58.1 | 56.7 | 53.9 | 51.5 |

Tom Moeller
AuthorMore in Author Profile »Prior to joining Haver Analytics in 2000, Mr. Moeller worked as the Economist at Chancellor Capital Management from 1985 to 1999. There, he developed comprehensive economic forecasts and interpreted economic data for equity and fixed income portfolio managers. Also at Chancellor, Mr. Moeller worked as an equity analyst and was responsible for researching and rating companies in the economically sensitive automobile and housing industries for investment in Chancellor’s equity portfolio. Prior to joining Chancellor, Mr. Moeller was an Economist at Citibank from 1979 to 1984. He also analyzed pricing behavior in the metals industry for the Council on Wage and Price Stability in Washington, D.C. In 1999, Mr. Moeller received the award for most accurate forecast from the Forecasters' Club of New York. From 1990 to 1992 he was President of the New York Association for Business Economists. Mr. Moeller earned an M.B.A. in Finance from Fordham University, where he graduated in 1987. He holds a Bachelor of Arts in Economics from George Washington University.
More Economy in Brief


