 Global| Jan 04 2013
U.S. Job Growth Continues To Be Moderately Positive
by:Tom Moeller
|in:Economy in Brief
Summary
Labor market improvement during 2012 is evidenced in most employment measures. For all of last year, nonfarm payrolls grew 1.4% and added to their 1.2% rise in 2011. Regrettably, however, these gains pale in comparison to the 4.0% or [...]
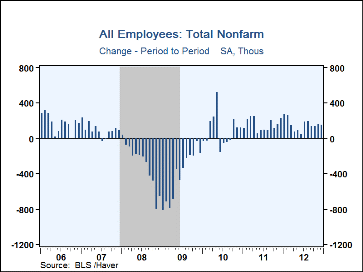
Labor market improvement during 2012 is evidenced in most employment measures. For all of last year, nonfarm payrolls grew 1.4% and added to their 1.2% rise in 2011. Regrettably, however, these gains pale in comparison to the 4.0% or higher growth rates following severe postwar economic downturns. Finishing out 2012, nonfarm payrolls matched expectations and rose 155,000 in December (1.4% y/y). That followed an upwardly revised 161,000 November gain and a little-changed 137,000 October advance.
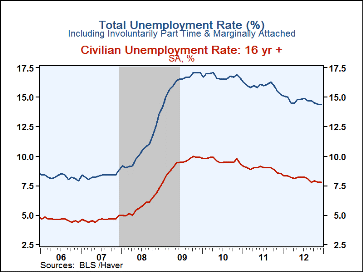
Job market improvement in 2012 also is evidenced by the jobless rate which fell to 8.1% versus 8.9% for all of 2011, and the high of 9.6% in 2010. The rate held steady last month at 7.8% and prior months' data were revised up slightly. A 7.7% December rate was expected. Including workers who were marginally attached or part time for economic reasons, the unemployment rate was 14.4% last month and 14.7% for the year.
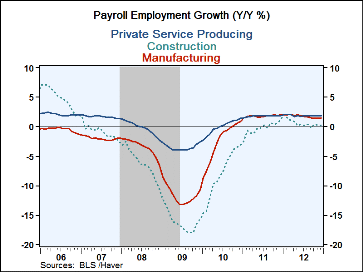
From the establishment survey of the labor market, nonfarm payrolls grew 155,000 last month and 161,000 in November. These numbers have improved of late but have slowed versus the period, December '10 thru February '11, when payrolls rose 223,000 or more each month. Factory sector jobs grew 25,000 in December (1.5% y/y) as they recovered following Hurricane Sandy. Construction jobs also jumped 30,000 (0.3% y/y) and matched the earlier advance reached in September 2011. In the service sector, job growth backpedaled last month. Private service sector employment rose just 109,000 (1.8% y/y), the weakest monthly advance in six months. Retail trade jobs declined 11,300 (+1.1% y/y) while professional & business services employment increased a moderate 19,000 (+2.7% y/y). Payrolls in the government sector fell 13,000 (-0.3% y/y), led by a 14,000 drop (-0.4% y/y) in local government jobs and a 3,000 drop (-1.5% y/y) in federal government employment. To the upside, health care & social assistance employment surged 55,000 (2.3% y/y) while leisure & hospitality jobs rose 31,000 (2.4% y/y).
The length of the workweek improved to 34.5 hours, the most since September. Together with the rise in employment, that was enough to pull aggregate hours worked up 0.4% (2.0% y/y) in December, 1.8% for the quarter and by 2.1% for the year.
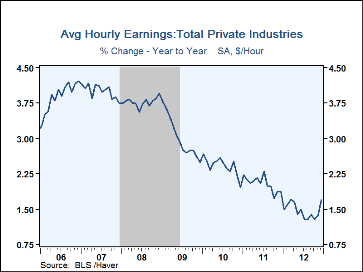
Job growth was accompanied by better earnings. Average hourly earnings increased 0.3%, the strongest monthly advance since July of 2011. Moreover, the 1.7% y/y rise was the best in many months. A 5.3% y/y gain in earnings in the financial sector led the improvement.
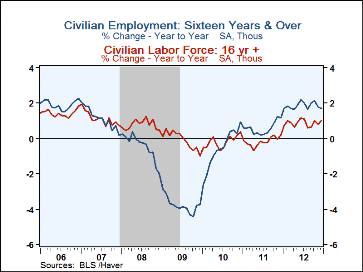
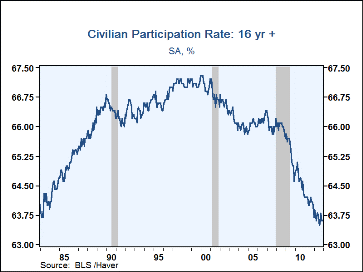
The survey of U.S. households showed a stable 7.8% rate of unemployment. That compares to the consensus expectation for a 7.7% rate; data back to 2007 were revised. The decline reflected a minimal 28,000 rise (1.7% y/y) in employment and a 192,000 increase (1.0% y/y) in the labor force. That gain in the labor force was accompanied by a 63.6% participation rate which was the lowest since 1981. The number of people not in the labor force has been growing at a steady 2.5% rate.
The figures referenced above are available in Haver's USECON database. Additional detail can be found in the LABOR and in the EMPL databases. The expectation figures are from Action Economics and are in the AS1REPNA database.
| Employment: (M/M Chg., 000s) | Dec | Nov | Oct | Y/Y | 2012 | 2011 | 2010 |
|---|---|---|---|---|---|---|---|
| Payroll Employment | 155 | 161 | 137 | 1.4% | 1.4% | 1.2% | -0.7% |
| Previous | -- | 146 | 138 | -- | -- | -- | -- |
| Manufacturing | 25 | 5 | 7 | 1.5 | 1.8 | 1.8 | -2.7 |
| Construction | 30 | -10 | 25 | 0.3 | 0.6 | -0.3 | -8.2 |
| Private Service Producing | 109 | 172 | 177 | 1.8 | 1.9 | 1.8 | -0.1 |
| Government | -13 | -10 | -66 | -0.3 | -0.6 | -1.7 | -0.3 |
| Average Weekly Hours - Private Sector | 34.5 | 34.4 | 34.3 | 34.4 (Dec'11) |
34.5 | 34.4 | 34.1 |
| Average Private Sector Hourly Earnings (%) | 0.3 | 0.2 | 0.1 | 1.7 | 1.5 | 2.0 | 2.4 |
| Unemployment Rate (%) | 7.8 | 7.8 | 7.9 | 8.5 (Dec'11) |
8.1 | 8.9 | 9.6 |
Tom Moeller
AuthorMore in Author Profile »Prior to joining Haver Analytics in 2000, Mr. Moeller worked as the Economist at Chancellor Capital Management from 1985 to 1999. There, he developed comprehensive economic forecasts and interpreted economic data for equity and fixed income portfolio managers. Also at Chancellor, Mr. Moeller worked as an equity analyst and was responsible for researching and rating companies in the economically sensitive automobile and housing industries for investment in Chancellor’s equity portfolio. Prior to joining Chancellor, Mr. Moeller was an Economist at Citibank from 1979 to 1984. He also analyzed pricing behavior in the metals industry for the Council on Wage and Price Stability in Washington, D.C. In 1999, Mr. Moeller received the award for most accurate forecast from the Forecasters' Club of New York. From 1990 to 1992 he was President of the New York Association for Business Economists. Mr. Moeller earned an M.B.A. in Finance from Fordham University, where he graduated in 1987. He holds a Bachelor of Arts in Economics from George Washington University.
More Economy in Brief
 Global| Feb 05 2026
Charts of the Week: Balanced Policy, Resilient Data and AI Narratives
by:Andrew Cates


