 Global| Oct 03 2007
U.S. ISM Nonmanufacturing Index Dipped
by:Tom Moeller
|in:Economy in Brief
Summary
According to the Institute for Supply Management, the nonmanufacturing sector Business Activity Index for September dipped to 54.8 versus August which was unchanged from July. The dip was in line with Consensus expectations for a [...]
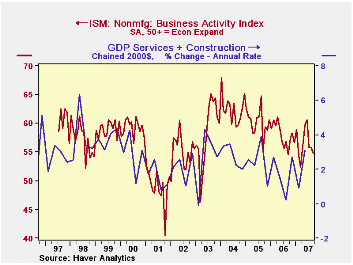
According to the Institute for Supply Management, the nonmanufacturing sector Business Activity Index for September dipped to 54.8 versus August which was unchanged from July. The dip was in line with Consensus expectations for a decline to 55.0.
Since the series' inception in 1997 there has been a 44% correlation between the level of the Business Activity Index and the Q/Q change in real GDP for services plus construction.
The new orders sub index provided much of the downward drift to the Business Activity Index and fell to 53.4 from 57.0 in August. The latest reading is near the lowest level since 2003.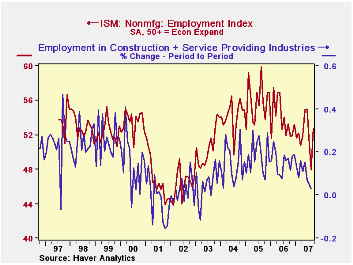
The employment sub index, however, recovered most of the declines during the prior two months with a rise to 52.7, back signaling positive jobs growth. Since the series' inception in 1997 there has been a 56% correlation between the level of the ISM nonmanufacturing employment index and the m/m change in payroll employment in the service producing plus the construction industries.
Pricing power improved and recovered most of the declines during the prior three months. Since inception ten years ago, there has been a 60% correlation between the price index and the q/q change in the GDP services chain price index.
ISM surveys more than 370 purchasing managers in more than 62 industries including construction, law firms, hospitals, government and retailers. The non-manufacturing survey dates back to July 1997.The Business Activity Index for the nonmanufacturing sector reflects a question separate from the subgroups mentioned above. In contrast, the NAPM manufacturing sector composite index is a weighted average of five components.
| ISM Nonmanufacturing Survey | September | August | September '06 | 2006 | 2005 | 2004 |
|---|---|---|---|---|---|---|
| Business Activity Index | 54.8 | 55.8 | 54.6 | 58.0 | 60.2 | 62.5 |
| Prices Index | 66.1 | 58.6 | 58.2 | 65.2 | 68.0 | 68.8 |

Tom Moeller
AuthorMore in Author Profile »Prior to joining Haver Analytics in 2000, Mr. Moeller worked as the Economist at Chancellor Capital Management from 1985 to 1999. There, he developed comprehensive economic forecasts and interpreted economic data for equity and fixed income portfolio managers. Also at Chancellor, Mr. Moeller worked as an equity analyst and was responsible for researching and rating companies in the economically sensitive automobile and housing industries for investment in Chancellor’s equity portfolio. Prior to joining Chancellor, Mr. Moeller was an Economist at Citibank from 1979 to 1984. He also analyzed pricing behavior in the metals industry for the Council on Wage and Price Stability in Washington, D.C. In 1999, Mr. Moeller received the award for most accurate forecast from the Forecasters' Club of New York. From 1990 to 1992 he was President of the New York Association for Business Economists. Mr. Moeller earned an M.B.A. in Finance from Fordham University, where he graduated in 1987. He holds a Bachelor of Arts in Economics from George Washington University.
More Economy in Brief


