 Global| Dec 05 2007
U.S. ISM Non-manufacturing Index Slipped, Prices Soared
by:Tom Moeller
|in:Economy in Brief
Summary
According to the Institute for Supply Management, the November Business Activity Index for the non-manufacturing sector slipped to 54.1 from 55.8. A figure above 50 indicates rising activity and the m/m decline somewhat outpaced [...]
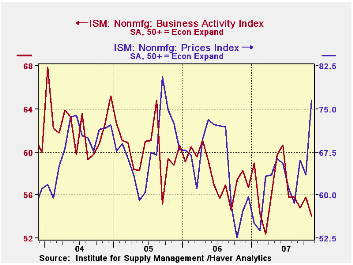
According to the Institute for Supply Management, the November Business Activity Index for the non-manufacturing sector slipped to 54.1 from 55.8. A figure above 50 indicates rising activity and the m/m decline somewhat outpaced Consensus expectations for a lesser fall.
Since the series' inception in 1997 there has been a 44% correlation between the level of the Business Activity Index in the non-manufacturing sector and the Q/Q change in real GDP for the services and the construction sectors. The correlation of the factory sector ISM index with the change in real GDP less just services is a higher 57%, though over the last ten years it only has been 34%.
The new orders sub index of the Business Activity fell sharply to 51.1 from 55.7. The latest was the lowest reading since early 2003.
The employment sub index similarly fell to 50.8, just barely suggesting rising employment. Since the series' inception in 1997 there has been a 56% correlation between the level of the ISM non-manufacturing employment index and the m/m change in payroll employment in the service producing plus the construction industries.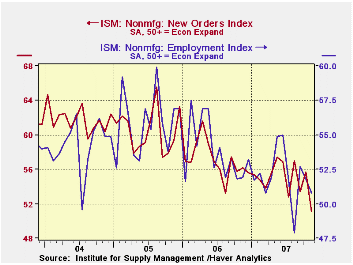
Pricing power surged m/m to its highest level since 2005. Since inception ten years ago, there has been a 60% correlation between the price index and the q/q change in the GDP services chain price index.
ISM surveys more than 370 purchasing managers in more than 62 industries including construction, law firms, hospitals, government and retailers. The non-manufacturing survey dates back to July 1997.The Business Activity Index for the non-manufacturing sector reflects a question separate from the subgroups mentioned above. In contrast, the ISM manufacturing sector composite index is a weighted average of five components.
| ISM Nonmanufacturing Survey | November | October | November '06 | 2006 | 2005 | 2004 |
|---|---|---|---|---|---|---|
| Business Activity Index | 54.1 | 55.8 | 57.4 | 58.0 | 60.2 | 62.5 |
| Prices Index | 76.5 | 63.5 | 52.6 | 65.2 | 68.0 | 68.8 |

Tom Moeller
AuthorMore in Author Profile »Prior to joining Haver Analytics in 2000, Mr. Moeller worked as the Economist at Chancellor Capital Management from 1985 to 1999. There, he developed comprehensive economic forecasts and interpreted economic data for equity and fixed income portfolio managers. Also at Chancellor, Mr. Moeller worked as an equity analyst and was responsible for researching and rating companies in the economically sensitive automobile and housing industries for investment in Chancellor’s equity portfolio. Prior to joining Chancellor, Mr. Moeller was an Economist at Citibank from 1979 to 1984. He also analyzed pricing behavior in the metals industry for the Council on Wage and Price Stability in Washington, D.C. In 1999, Mr. Moeller received the award for most accurate forecast from the Forecasters' Club of New York. From 1990 to 1992 he was President of the New York Association for Business Economists. Mr. Moeller earned an M.B.A. in Finance from Fordham University, where he graduated in 1987. He holds a Bachelor of Arts in Economics from George Washington University.
More Economy in Brief


