 Global| Sep 29 2011
U.S. Initial Unemployment Insurance Claims Are Lowest Since April
by:Tom Moeller
|in:Economy in Brief
Summary
The job market may be on the mend.Initial claims for jobless insurance dropped a sharp 37,000 to 391,000,000 last week from 428,000 (revised from 423,000). The latest figure was the lowest since the first week of April and was far [...]
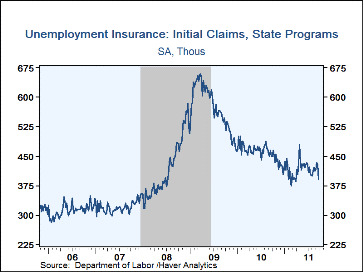
The job market may be on the mend.Initial claims for jobless insurance dropped a sharp 37,000 to 391,000,000 last week from 428,000 (revised from 423,000). The latest figure was the lowest since the first week of April and was far lower than Consensus expectations for 420,000 claims, according to the Action Economics survey. The decline lowered the 4-week moving average of claims to 417,000.
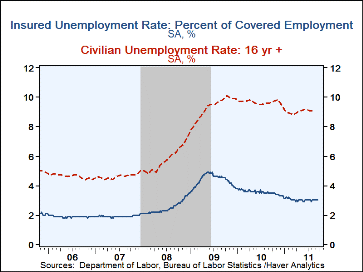
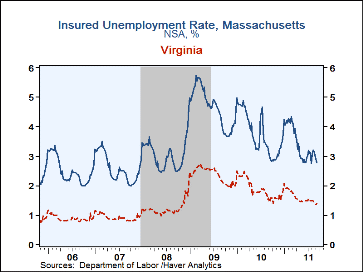
Continuing claims for unemployment insurance slipped to 3.729M in the September 17th week. It has been trending sideways since early this year. The insured unemployment rate held at 3.0%. By state, the rate varied with Virginia (1.4%), Texas (1.8%), Ohio (1.9%), Colorado (2.1%) and Tennessee (2.1%) at the low end of the range. The rates in Connecticut (3.3%), Nevada (3.4%), California (3.5%), New Jersey (3.7%) and Pennsylvania (3.9%) were at the high end.
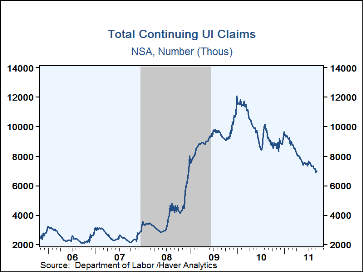
The grand total of those receiving unemployment insurance, including extended programs run by the states and the federal government, was 6.985M as of September 10, down by one-quarter y/y. Regular extended benefits, with eligibility dependent on conditions in individual states, recovered the prior week's decline with a rise to 534,870 (-40.4% y/y) and those on the special "EUC 2008" programs jumped to 3.037M (-23.4% y/y).
Data on weekly unemployment insurance programs are contained in Haver's WEEKLY database, including the seasonal factor series, and they are summarized monthly in USECON. Data for individual states, including the unemployment rates that determine individual state eligibility for the extended benefits programs and specific "tiers" of the emergency program, are in REGIONW, a database of weekly data for states and various regional divisions. Action Economics estimates are in AS1REPNA.
| Unemployment Insurance(000s) | 9/24/11 | 9/17/11 | 9/10/11 | Y/Y% | 2010 | 2009 | 2008 |
|---|---|---|---|---|---|---|---|
| Initial Claims | 391 | 428 | 432 | -13.1 | 459 | 574 | 418 |
| Continuing Claims | -- | 3,729 | 3,741 | -16.4 | 4,544 | 5,807 | 3,338 |
| Insured Unemployment Rate(%) | -- | 3.0 | 3.0 | 3.5 (9/10) |
3.6 | 4.4 | 2.5 |
| Total "All Programs" (NSA) | -- | -- | 6.985 | -21.8 | 9.850M | 9.163M | 3.903M |
Tom Moeller
AuthorMore in Author Profile »Prior to joining Haver Analytics in 2000, Mr. Moeller worked as the Economist at Chancellor Capital Management from 1985 to 1999. There, he developed comprehensive economic forecasts and interpreted economic data for equity and fixed income portfolio managers. Also at Chancellor, Mr. Moeller worked as an equity analyst and was responsible for researching and rating companies in the economically sensitive automobile and housing industries for investment in Chancellor’s equity portfolio. Prior to joining Chancellor, Mr. Moeller was an Economist at Citibank from 1979 to 1984. He also analyzed pricing behavior in the metals industry for the Council on Wage and Price Stability in Washington, D.C. In 1999, Mr. Moeller received the award for most accurate forecast from the Forecasters' Club of New York. From 1990 to 1992 he was President of the New York Association for Business Economists. Mr. Moeller earned an M.B.A. in Finance from Fordham University, where he graduated in 1987. He holds a Bachelor of Arts in Economics from George Washington University.
More Economy in Brief
 Global| Feb 05 2026
Charts of the Week: Balanced Policy, Resilient Data and AI Narratives
by:Andrew Cates


