 Global| May 27 2010
U.S. Initial Jobless Insurance Claims Slip
by:Tom Moeller
|in:Economy in Brief
Summary
The labor market's improvement continues. That's the message from the Bureau of Labor Statistics report that initial claims for jobless insurance slipped 14,000 to 460,000 following last week's upwardly revised 28,000 increase. The [...]
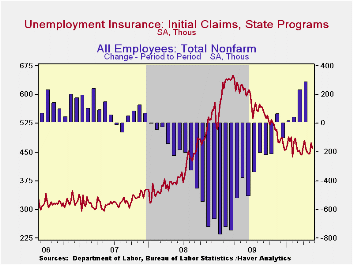
The labor market's improvement continues. That's the message from the Bureau of Labor Statistics report that initial claims for jobless insurance slipped 14,000 to 460,000 following last week's upwardly revised 28,000 increase. The latest disappointed Consensus expectations for a decline to 455,000 claims but claims remained near this cycle's lowest. Last week's figure was down from the recession peak of 651,000 reached in March of 2009. The four-week moving average of initial claims ticked up to 456,500.
A 49,000 decline in continuing claims for unemployment insurance during the latest week followed the prior week's 3,000 decline, which was less than reported initially. Claims were near the cycle low and down by one-third from the June '09 peak. The overall decline is a function of the improved job market but also reflects the exhaustion of 26 weeks of unemployment benefits. Continuing claims provide an indication of workers' ability to find employment. The four-week average of continuing claims at 4.637M remained near the cycle low. This series dates back to 1966.
Extended benefits for unemployment insurance rose further w/w to 278,953. However, they were down by roughly one-half from a peak of 597,688 reached in November.
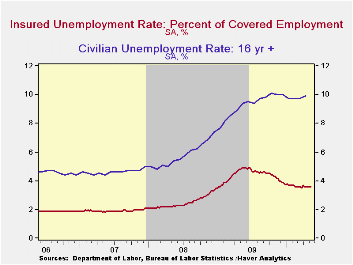
The insured unemployment rate remained at 3.6% where it has been since mid-February. The rate reached a high of 4.9% during May of 2009. During the last ten years, there has been a 96% correlation between the level of the insured unemployment rate and the overall rate of unemployment published by the Bureau of Labor Statistics.
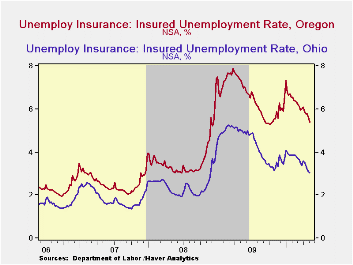
The highest insured unemployment rates in the week ending May 8 were in Puerto Rico (6.2 percent), Alaska (5.9), Oregon (5.4), Nevada (4.9), California (4.8), Pennsylvania (4.7), Wisconsin (4.5), North Carolina (4.4), Montana (4.3), and Connecticut (4.2). The lowest insured unemployment rates were in Virginia (1.8), Texas (2.1), Tennessee (2.6), Wyoming (2.7), Georgia (2.8), Maryland (2.9), Florida (3.0), Ohio (3.0), New York (3.3) and Maine (3.2). These data are not seasonally adjusted but the overall insured unemployment rate is.
The unemployment insurance claims data is available in Haver's WEEKLY database and the state data is in the REGIONW database.
Distortionary Fiscal Policy and Monetary Policy Goals from the Federal Reserve Bank of Kansas City is available here.
| Unemployment Insurance (000s) | 05/22/10 | 05/15/10 | 05/08/10 | Y/Y | 2009 | 2008 | 2007 |
|---|---|---|---|---|---|---|---|
| Initial Claims | 460 | 472 | 446 | -24.7% | 572 | 419 | 321 |
| Continuing Claims | -- | 4,607 | 4,656 | -29.1 | 5,809 | 3,340 | 2,549 |
| Insured Unemployment Rate (%) | -- | 3.6 | 3.6 | 4.9 (5/2009) | 4.4 | 2.5 | 1.9 |

Tom Moeller
AuthorMore in Author Profile »Prior to joining Haver Analytics in 2000, Mr. Moeller worked as the Economist at Chancellor Capital Management from 1985 to 1999. There, he developed comprehensive economic forecasts and interpreted economic data for equity and fixed income portfolio managers. Also at Chancellor, Mr. Moeller worked as an equity analyst and was responsible for researching and rating companies in the economically sensitive automobile and housing industries for investment in Chancellor’s equity portfolio. Prior to joining Chancellor, Mr. Moeller was an Economist at Citibank from 1979 to 1984. He also analyzed pricing behavior in the metals industry for the Council on Wage and Price Stability in Washington, D.C. In 1999, Mr. Moeller received the award for most accurate forecast from the Forecasters' Club of New York. From 1990 to 1992 he was President of the New York Association for Business Economists. Mr. Moeller earned an M.B.A. in Finance from Fordham University, where he graduated in 1987. He holds a Bachelor of Arts in Economics from George Washington University.
More Economy in Brief


