 Global| Mar 05 2009
U.S. Initial Claims For Jobless Insurance Fell Back
by:Tom Moeller
|in:Economy in Brief
Summary
Weakness in the U.S. labor market eased slightly last week. A 31,000 decline in initial claims for unemployment insurance reversed the gain recorded in the prior week, which had brought claims to a level not seen since 1982. The Labor [...]
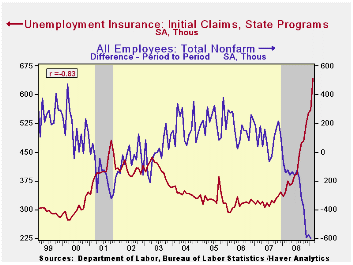
Weakness in the U.S. labor market eased slightly last week. A 31,000 decline in initial claims for unemployment insurance reversed the gain recorded in the prior week, which had brought claims to a level not seen since 1982. The Labor Department indicated that initial claims for unemployment insurance fell last week to 639,000 from 670,000, a higher figure than initially reported. The latest reading was lower than Consensus expectations for 650,000 initial claims.
The Labor Department will release the February payroll employment figures tomorrow. For last month, claims averaged 642,000 versus the January average of 561,000. During the last ten years there has been an 83% correlation between the level of initial claims and the month-to-month change in nonfarm payrolls.
In the week ending February 21 the largest increases in claims were in Illinois (+3,791), Massachusetts (+3,438), Missouri (+3,027), Ohio (+2,731), and California (+2,677), while the largest decreases were in Florida (-3,586), Virginia (-3,490), New York (-3,420), Michigan (-3,373), and New Jersey (-2,266).
Continuing claims for unemployment insurance eased a slight 14,000 after two weeks of triple digit increase. At 5,106,000, the level of continuing claims remained near the record level. The series dates back to 1966. The four-week average of continuing claims rose 76,800 to 5,011,000. Continuing claims provide some indication of workers' ability to find employment and they lag the initial claims figures by one week.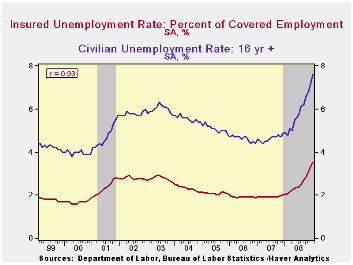
Though the latest level of continuing claims was a record, the labor force has grown as well, by nearly 30% over the last twenty years. Therefore, the insured rate of unemployment was not at a new record and it remained stable week-to-week at 3.8% which was the highest since 1983. During the last ten years there has been a 93% correlation between the level of the insured unemployment rate and the overall rate of unemployment published by the Bureau of Labor Statistics. The highest insured rates of unemployment in the week ending February 14 were in Michigan (8.2 percent), Oregon (7.3), Idaho (7.1), Pennsylvania (6.7), Wisconsin (6.5), Rhode Island (6.2), Alaska (6.0), Nevada (6.0), Montana (5.8), and Puerto Rico (5.8).
The unemployment insurance claim data is available in Haver's WEEKLY database.
The Fed's latest Beige Book covering regional economic conditions can be found here.
| Unemployment Insurance (000s) | 02/28/09 | 02/21/09 | 02/14/09 | Y/Y | 2008 | 2007 | 2006 |
|---|---|---|---|---|---|---|---|
| Initial Claims | 639 | 670 | 631 | 85.8% | 420 | 321 | 313 |
| Continuing Claims | -- | 5,106 | 5,120 | 81.8% | 3,342 | 2,552 | 2,459 |

Tom Moeller
AuthorMore in Author Profile »Prior to joining Haver Analytics in 2000, Mr. Moeller worked as the Economist at Chancellor Capital Management from 1985 to 1999. There, he developed comprehensive economic forecasts and interpreted economic data for equity and fixed income portfolio managers. Also at Chancellor, Mr. Moeller worked as an equity analyst and was responsible for researching and rating companies in the economically sensitive automobile and housing industries for investment in Chancellor’s equity portfolio. Prior to joining Chancellor, Mr. Moeller was an Economist at Citibank from 1979 to 1984. He also analyzed pricing behavior in the metals industry for the Council on Wage and Price Stability in Washington, D.C. In 1999, Mr. Moeller received the award for most accurate forecast from the Forecasters' Club of New York. From 1990 to 1992 he was President of the New York Association for Business Economists. Mr. Moeller earned an M.B.A. in Finance from Fordham University, where he graduated in 1987. He holds a Bachelor of Arts in Economics from George Washington University.
More Economy in Brief


