 Global| Mar 11 2010
U.S. Initial Claims For Insurance Slip Again
by:Tom Moeller
|in:Economy in Brief
Summary
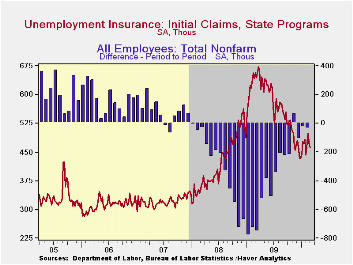
Improvement in the labor market is ongoing, but slowing. Initial claims for jobless insurance slipped 6,000 last week to 462,000 from a little revised 468,000 during the prior week. Versus last month claims fell slightly and from [...]

Improvement in the labor market is ongoing, but slowing. Initial claims for jobless insurance slipped 6,000 last week to 462,000 from a little revised 468,000 during the prior week. Versus last month claims fell slightly and from December they're roughly flat. This flattening compares to the earlier sharp decline from the recession peak of 674,000 hit twelve months ago. Moreover, claims remained near the lowest level since January 2009. The weekly decline about matched the Consensus expectation. The four-week moving average of initial claims inched up to 475,500.
Continuing claims for unemployment insurance during the latest week remained near the cycle-low and were down by one-third since late-June. The overall decline is a function of the improved job market but also reflects the exhaustion of 26 weeks of unemployment benefits. Continuing claims provide an indication of workers' ability to find employment. The four-week average of continuing claims held steady at the cycle low of 4.581 mil. This series dates back to 1966.
Extended benefits for unemployment insurance dropped sharply to another cycle low of 163,291. They were down by two-thirds from a peak of 597,688 reached in November.Each State administers a separate unemployment insurance program within guidelines established by Federal law. Benefit amounts and the length of time benefits are received and determined by State law. For example, in both Michigan and New York an additional 73 weeks of benefits are available.
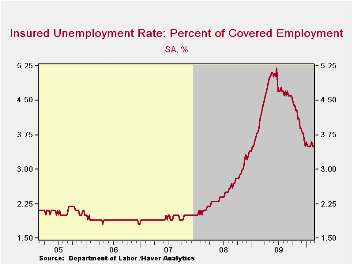
The insured rate of unemployment held steady at 3.5% during the prior week. The rate reached a high of 5.2% during late-June. During the last ten years, there has been a 93% correlation between the level of the insured unemployment rate and the overall rate of unemployment published by the Bureau of Labor Statistics.
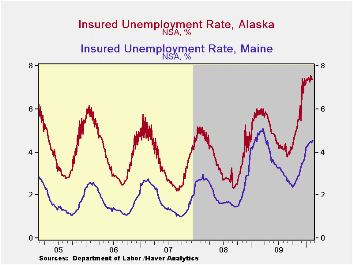
The highest insured unemployment rates in the week ending February 14 were in Alaska (7.4% percent), Oregon (6.4), Idaho (6.3), Montana (6.2), Wisconsin (6.2), Pennsylvania (6.2), Michigan (5.7), Nevada (5.6) and North Carolina (5.2). The lowest insured unemployment rates were in Virginia (2.3), Texas (2.4), Florida (3.3), Georgia (3.3), Mississippi (3.6), Wyoming (3.7), Maryland (3.7), Ohio (3.8), Indiana (3.9), New York (4.3) and Maine (4.6). These data are not seasonally adjusted but the overall insured unemployment rate is.


| Unemployment Insurance (000s) | 3/6/10 | 2/27/10 | 2/20/10 | Y/Y | 2009 | 2008 | 2007 |
|---|---|---|---|---|---|---|---|
| Initial Claims | 462 | 468 | 498 | -29.7% | 573 | 419 | 321 |
| Continuing Claims | -- | 4,558 | 4,521 | -13.2% | 5,835 | 3,345 | 2,552 |
| Insured Unemployment Rate (%) | -- | 3.5 | 3.5 | 4.3 (3/2009) | 4.4 | 2.5 | 1.9 |
Tom Moeller
AuthorMore in Author Profile »Prior to joining Haver Analytics in 2000, Mr. Moeller worked as the Economist at Chancellor Capital Management from 1985 to 1999. There, he developed comprehensive economic forecasts and interpreted economic data for equity and fixed income portfolio managers. Also at Chancellor, Mr. Moeller worked as an equity analyst and was responsible for researching and rating companies in the economically sensitive automobile and housing industries for investment in Chancellor’s equity portfolio. Prior to joining Chancellor, Mr. Moeller was an Economist at Citibank from 1979 to 1984. He also analyzed pricing behavior in the metals industry for the Council on Wage and Price Stability in Washington, D.C. In 1999, Mr. Moeller received the award for most accurate forecast from the Forecasters' Club of New York. From 1990 to 1992 he was President of the New York Association for Business Economists. Mr. Moeller earned an M.B.A. in Finance from Fordham University, where he graduated in 1987. He holds a Bachelor of Arts in Economics from George Washington University.
More Economy in Brief
 Global| Feb 05 2026
Charts of the Week: Balanced Policy, Resilient Data and AI Narratives
by:Andrew Cates


