 Global| Mar 04 2010
U.S. Initial Claims For Insurance Fall Back
by:Tom Moeller
|in:Economy in Brief
Summary
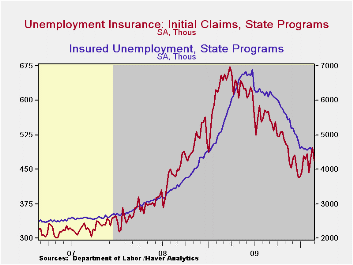
Today's Labor Department report indicated that initial claims for jobless insurance fell 29,000 last week to 469,000 from an upwardly revised 498,000 during the prior week. Claims rose slightly for the full month but remained down [...]
 Today's
Labor Department report indicated that initial claims for jobless
insurance fell 29,000 last week to 469,000 from an upwardly revised
498,000 during the prior week. Claims rose slightly for the full month
but remained down from the recession peak of 674,000 hit last March.
Moreover, claims remained near the lowest level since January 2009. The
weekly decline in claims slightly exceeded Consensus expectations for a
drop to 475,000. The four-week moving average of initial claims slipped
to 470,750.
Today's
Labor Department report indicated that initial claims for jobless
insurance fell 29,000 last week to 469,000 from an upwardly revised
498,000 during the prior week. Claims rose slightly for the full month
but remained down from the recession peak of 674,000 hit last March.
Moreover, claims remained near the lowest level since January 2009. The
weekly decline in claims slightly exceeded Consensus expectations for a
drop to 475,000. The four-week moving average of initial claims slipped
to 470,750.
Continuing claims for unemployment insurance during the latest week fell to a new cycle-low and were down by one-third since late-June. The overall decline is a function of the improved job market but also reflects the exhaustion of 26 weeks of unemployment benefits. Continuing claims provide an indication of workers' ability to find employment. The four-week average of continuing claims fell to a cycle low of 4,575,750. This series dates back to 1966.
Extended benefits for unemployment insurance dropped sharply to another cycle low of 178,469. They were down by two-thirds from a peak of 597,688 reached in November.
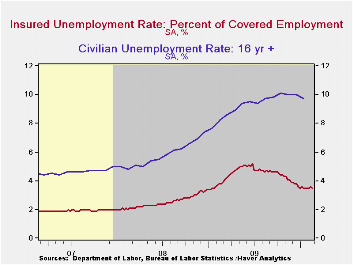
The insured rate of unemployment slipped to 3.5% from an upwardly revised 3.6% during the prior week. The rate reached a high of 5.2% during late-June. During the last ten years, there has been a 93% correlation between the level of the insured unemployment rate and the overall rate of unemployment published by the Bureau of Labor Statistics.
The highest insured unemployment rates in the week ending February 14 were in Alaska (7.4% percent), Oregon (6.4), Idaho (6.3), Montana (6.3), Wisconsin (6.2), Michigan (5.8), Nevada (5.7), Pennsylvania (6.4), and North Carolina (5.4). The lowest insured unemployment rates were in Virginia (2.3), Texas (2.4), Florida (3.2), Georgia (3.4), Mississippi (3.6), Wyoming (3.7), Ohio (3.8), Maryland (3.9), Indiana (4.0), New York (4.1) and Maine (4.4). These data are not seasonally adjusted but the overall insured unemployment rate is.
The unemployment insurance claims data is available in Haver's WEEKLY database and the state data is in the REGIONW database.
Changes in the Aggregate Labor Force Participation Rate from the Federal Reserve Bank of Atlanta is available here.
| Unemployment Insurance (000s) | 2/27/10 | 2/20/10 | 2/13/10 | Y/Y | 2009 | 2008 | 2007 |
|---|---|---|---|---|---|---|---|
| Initial Claims | 469 | 498 | 474 | -27.1% | 573 | 419 | 321 |
| Continuing Claims | -- | 4,500 | 4,634 | -11.3% | 5,835 | 3,345 | 2,552 |
| Insured Unemployment Rate (%) | -- | 3.5 | 3.6 | 4.3 (3/2009) | 4.4 | 2.5 | 1.9 |

Tom Moeller
AuthorMore in Author Profile »Prior to joining Haver Analytics in 2000, Mr. Moeller worked as the Economist at Chancellor Capital Management from 1985 to 1999. There, he developed comprehensive economic forecasts and interpreted economic data for equity and fixed income portfolio managers. Also at Chancellor, Mr. Moeller worked as an equity analyst and was responsible for researching and rating companies in the economically sensitive automobile and housing industries for investment in Chancellor’s equity portfolio. Prior to joining Chancellor, Mr. Moeller was an Economist at Citibank from 1979 to 1984. He also analyzed pricing behavior in the metals industry for the Council on Wage and Price Stability in Washington, D.C. In 1999, Mr. Moeller received the award for most accurate forecast from the Forecasters' Club of New York. From 1990 to 1992 he was President of the New York Association for Business Economists. Mr. Moeller earned an M.B.A. in Finance from Fordham University, where he graduated in 1987. He holds a Bachelor of Arts in Economics from George Washington University.
More Economy in Brief


