 Global| Aug 15 2008
U.S. Industrial Production Rose
by:Tom Moeller
|in:Economy in Brief
Summary
For July, industrial production rose 0.2% after an unrevised 0.5% gain during June. Consensus expectations had been for no change in output last month. Utility output reversed its June increase and fell by 1.8% as the summer heat [...]
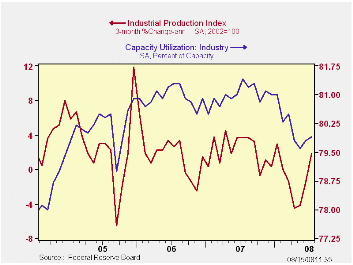
For July, industrial production rose 0.2% after an unrevised 0.5% gain during June. Consensus expectations had been for no change in output last month.
Utility output reversed its June increase and fell by 1.8% as the summer heat moderated.
Factory output increased 0.4% which was its best monthly increase since last September. In addition, the three-month rate change improved to 2.2% (AR) which was its best since since last September. Output of motor vehicles & parts was strong during the last two months and rose 3.6% (-10.4% y/y) after a 4.8% June increase. The strike was settled at American Axel company.
The trend in output outside the high-tech sector has been decidedly weak due to that strike. Less high-tech, factory output did repeat its June rise of 0.2% and three-month output growth rose to 1.9% (AR). But the industry detail continued mixed. July output of furniture fell 0.9% and at a 7.0% rate during the last three months. Apparel output dropped 0.5% last month. To the upside was output of electrical equipment rose at a 4.2% rate during the last three months. Machinery output recovered some of its earlier weakness with a 2.5% rise during the last three months.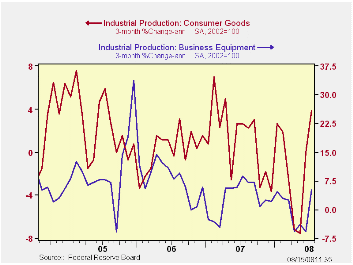
Production in the high tech sector rose 0.3% (17.4% y/y) during July but that y/y growth was down from the peak in March of 27.6%. Production of computers & office equipment rose 0.7% (15.4% y/y) but the three-month growth rate is slower at 6.9% (AR). Output of communications equipment fell 0.2% last month and three-month growth was a negative 1.4%.
Capacity utilization ticked up to 79.9%. Utilization in the factory sector rose to 77.8%, near its lowest also since late-2004.
Will Farmland Values Keep Booming? from the Federal Reserve Bank of Kansas City can be found here.
| INDUSTRIAL PRODUCTION (SA, %) | July | June | Y/Y | 2007 | 2006 | 2005 |
|---|---|---|---|---|---|---|
| Total Output | 0.2 | 0.5 | -0.2 | 1.7 | 2.2 | 3.3 |
| Manufacturing | 0.4 | 0.1 | -1.1 | 1.7 | 2.4 | 4.0 |
| Consumer Goods | 0.3 | 0.9 | -1.1 | 1.7 | 0.3 | 2.8 |
| Business Equipment | 0.8 | 0.2 | 1.2 | 3.3 | 10.4 | 7.3 |
| Construction Supplies | 0.2 | -0.2 | -5.3 | -2.5 | 2.2 | 4.5 |
| Utilities | -1.8 | 2.2 | 2.6 | 3.3 | -0.6 | 2.1 |
| Capacity Utilization | 79.9 | 79.8 | 81.4 | 81.0 | 80.9 | 80.2 |

Tom Moeller
AuthorMore in Author Profile »Prior to joining Haver Analytics in 2000, Mr. Moeller worked as the Economist at Chancellor Capital Management from 1985 to 1999. There, he developed comprehensive economic forecasts and interpreted economic data for equity and fixed income portfolio managers. Also at Chancellor, Mr. Moeller worked as an equity analyst and was responsible for researching and rating companies in the economically sensitive automobile and housing industries for investment in Chancellor’s equity portfolio. Prior to joining Chancellor, Mr. Moeller was an Economist at Citibank from 1979 to 1984. He also analyzed pricing behavior in the metals industry for the Council on Wage and Price Stability in Washington, D.C. In 1999, Mr. Moeller received the award for most accurate forecast from the Forecasters' Club of New York. From 1990 to 1992 he was President of the New York Association for Business Economists. Mr. Moeller earned an M.B.A. in Finance from Fordham University, where he graduated in 1987. He holds a Bachelor of Arts in Economics from George Washington University.
More Economy in Brief


