 Global| Dec 14 2007
U.S. Industrial Production Rose 0.3% and Recouped Half of the October Decline
by:Tom Moeller
|in:Economy in Brief
Summary
Industrial production rose 0.3% last month but the increase recovered less than half of the downwardly revised 0.7% drop in October. The Consensus expectation had been for a 0.2% rise. Factory output also recovered from an October [...]
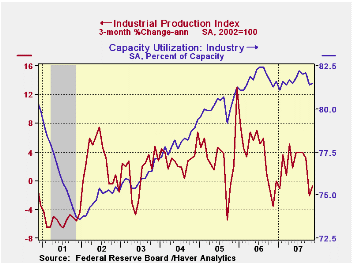
Industrial production rose 0.3% last month but the increase recovered less than half of the downwardly revised 0.7% drop in October. The Consensus expectation had been for a 0.2% rise.
Factory output also recovered from an October drop that was revised deeper. The 0.4% November increase left the three month change in output at -0.3%.
Output gains were broad based. Production in the motor vehicle & parts industries rose 1.6% and recovered all of the prior month's 1.5% drop. However that still left output down 1.6% from a year earlier. Output of furniture & related products bounced 0.4% (-2.0% y/y) following two months of sharp decline and output of construction supplies was unchanged (1.0% y/y).
Also in the consumer goods sector, production of computers & electronics rose 1.5% (+13.4% y/y). Output of apparel was unchanged (-3.8% y/y) but output of chemical products was down for the fourth straight month (-0.5% y/y).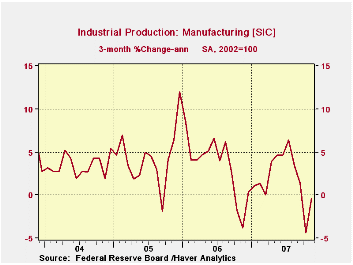
Output of business equipment rose a solid 1.0% (4.0% y/y). Output of information & processing equipment surged 2.3% (9.3% y/y). Three month growth amounted to 11.9% (AR). Production of industrial equipment inched up 0.2% after a 0.9% October shortfall. Three month growth recovered to 2.7% (AR), well below the 6.7% growth of last year.
In the materials category output rose 0.5% and recovered all of the prior month's decline. Production of durable consumer parts rose 0.9% (5.0 y/y). Production of durable equipment parts surged 1.4% (7.4% y/y) but consumer durable parts output only rose 0.5% (-0.5% y/y) after three months of sharp decline.
Capacity utilization inched up to 81.5% from a revised 81.4% in October. Utilization in the factory sector also rose slightly m/m to 79.8% and averaged 80.2% last year. Capacity rose 0.1% (1.8% y/y).The Macroeconomics of Oil Shocks from the Federal Reserve Bank of Philadelphia can be found here.
| INDUSTRIAL PRODUCTION (SA) | November | October | Y/Y | 2006 | 2005 | 2004 |
|---|---|---|---|---|---|---|
| Total | 0.3% | -0.7% | 2.2% | 4.0% | 3.2% | 2.5% |
| Manufacturing | 0.4% | -0.7% | 2.3% | 5.0% | 4.0% | 3.0% |
| Mining | 1.2% | -0.7% | 2.2% | 2.7% | -1.6% | -0.6% |
| Utilities | -1.4% | -1.4% | 1.2% | 0.2% | 2.0% | 1.4% |

Tom Moeller
AuthorMore in Author Profile »Prior to joining Haver Analytics in 2000, Mr. Moeller worked as the Economist at Chancellor Capital Management from 1985 to 1999. There, he developed comprehensive economic forecasts and interpreted economic data for equity and fixed income portfolio managers. Also at Chancellor, Mr. Moeller worked as an equity analyst and was responsible for researching and rating companies in the economically sensitive automobile and housing industries for investment in Chancellor’s equity portfolio. Prior to joining Chancellor, Mr. Moeller was an Economist at Citibank from 1979 to 1984. He also analyzed pricing behavior in the metals industry for the Council on Wage and Price Stability in Washington, D.C. In 1999, Mr. Moeller received the award for most accurate forecast from the Forecasters' Club of New York. From 1990 to 1992 he was President of the New York Association for Business Economists. Mr. Moeller earned an M.B.A. in Finance from Fordham University, where he graduated in 1987. He holds a Bachelor of Arts in Economics from George Washington University.
More Economy in Brief


