 Global| Jan 16 2004
U.S. Industrial Production Edged Up
by:Tom Moeller
|in:Economy in Brief
Summary
Industrial production edged up 0.1% in December, quite a bit less than Consensus expectations for a 0.7% rise. Utility output fell 1.3% (-0.7% y/y). The factory sector faired better last month and added 0.3% to the upwardly revised [...]
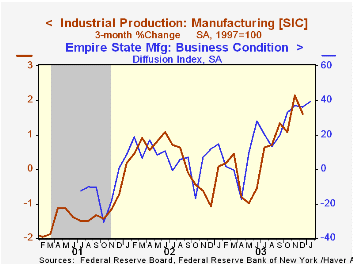
Industrial production edged up 0.1% in December, quite a bit less than Consensus expectations for a 0.7% rise.
Utility output fell 1.3% (-0.7% y/y).
The factory sector faired better last month and added 0.3% to the upwardly revised 1.1% surge in November (2.9% y/y).
Output in selected high-technology industries again led output higher in December and jumped 1.9% (24.5% y/y). Prior months' gains were revised lower. Output of computers and peripheral equipment rose 2.6%, about the average monthly gain during the last six months (15.5% y/y). Output of semiconductors & related equipment jumped 3.6% (41.8% y/y) though prior months' strength was lessened. Output of communications equipment fell 2.2% (+4.2% y/y).
Excluding high-tech, factory output inched 0.1% higher (1.6% y/y) but the 0.7% increase originally reported for November was revised to a 1.1% jump. The revision stemmed from a raised estimate of motor vehicle output (+5.1% y/y). Electrical equipment & appliance outputrose 0.8% (0.4% y/y) but the originally reported 1.1% November increase was revised to 0.1%. Furniture output fell 0.1% (-1.1% y/y) and November was revised to 0.7% from 1.7%.
Total capacity utilization held steady at 75.8%.
| Production & Capacity | Dec | Nov | Y/Y | 2003 | 2002 | 2001 |
|---|---|---|---|---|---|---|
| Industrial Production | 0.1% | 1.1% | 2.4% | 0.4% | -0.6% | -3.4% |
| Capacity Utilization | 75.8% | 75.8% | 74.9%(12/02) | 74.9% | 75.6% | 77.4% |
by Tom Moeller January 16, 2004
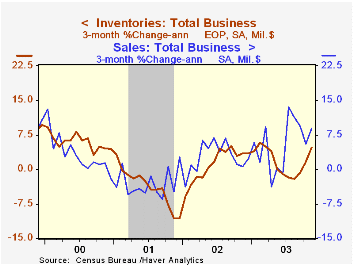
Total business inventories, up 0.3% in November, rose for the third consecutive month. The rise was in line with Consensus expectations for a 0.2% increase.
Retail inventories rose 0.7% in November for the second consecutive month. Higher inventories of motor vehicles & parts, up 1.2%, again led the gain.
Excluding autos, retail inventories rose 0.5%, the third firm increase in as many months. Inventories of furniture again rose strongly, up 0.9% (7.9% y/y). In addition, inventories of apparel rose for only the second month in the last eight (+3.0% y/y). Inventories at general merchandise stores fell 0.3% (+0.9% y/y).
Overall business sales rose 0.5% (5.4% y/y). Factory shipments and wholesale sales were modest in both months.
The inventory-to-sales ratio was stable at the record low 1.35.
"Has Inventory Volatility Returned? A Look at the Current Cycle" from the Federal Reserve Bank of New York can be found here.
| Business Inventories | Nov | Oct | Y/Y | 2002 | 2001 | 2000 |
|---|---|---|---|---|---|---|
| Total | 0.3% | 0.4% | 2.1% | 2.1% | -4.7% | 5.1% |
| Retail | 0.7% | 0.7% | 5.1% | 7.6% | -2.9% | 6.0% |
| Retail excl. Autos | 0.5% | 0.3% | 3.5% | 2.5% | -1.2% | 3.7% |
| Wholesale | 0.5% | 0.5% | 2.2% | 0.4% | -4.9% | 6.1% |
| Manufacturing | -0.2% | 0.1% | -1.0% | -1.8% | -6.1% | 3.8% |
by Tom Moeller January 16, 2004
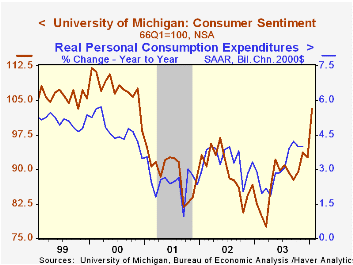
The University of Michigan’s consumer sentiment index spiked 11.4% higher m/m to 103.2, the highest level since December 2000. That was considerably better than Consensus expectations for a slight rise to 94.0.
During the last ten years there has been an 75% correlation between the level of consumer sentiment and the y/y change in real PCE. That correlation has risen to 84% during the last five years.
The current conditions index jumped 12.3% m/m to 108.9 and the expectations index added 10.8% m/m to 99.5.
The University of Michigan survey is not seasonally adjusted.It is based on telephone interviews with 250 households nationwide on personal finances and business and buying conditions. The survey is expanded to a total of 500 interviews at month end.
| University of Michigan | Mid-Jan | Dec | Y/Y | 2003 | 2002 | 2001 |
|---|---|---|---|---|---|---|
| Consumer Sentiment | 103.2 | 92.6 | 25.2% | 87.6 | 89.6 | 89.2 |
| Current Conditions | 108.9 | 97.0 | 12.0% | 97.2 | 97.5 | 100.1 |
| Consumer Expectations | 99.5 | 89.8 | 36.7% | 81.4 | 84.6 | 82.3 |

Tom Moeller
AuthorMore in Author Profile »Prior to joining Haver Analytics in 2000, Mr. Moeller worked as the Economist at Chancellor Capital Management from 1985 to 1999. There, he developed comprehensive economic forecasts and interpreted economic data for equity and fixed income portfolio managers. Also at Chancellor, Mr. Moeller worked as an equity analyst and was responsible for researching and rating companies in the economically sensitive automobile and housing industries for investment in Chancellor’s equity portfolio. Prior to joining Chancellor, Mr. Moeller was an Economist at Citibank from 1979 to 1984. He also analyzed pricing behavior in the metals industry for the Council on Wage and Price Stability in Washington, D.C. In 1999, Mr. Moeller received the award for most accurate forecast from the Forecasters' Club of New York. From 1990 to 1992 he was President of the New York Association for Business Economists. Mr. Moeller earned an M.B.A. in Finance from Fordham University, where he graduated in 1987. He holds a Bachelor of Arts in Economics from George Washington University.
More Economy in Brief


