 Global| May 27 2005
U.S. Income & Outlays Firm, Wage Revisions Upward
by:Tom Moeller
|in:Economy in Brief
Summary
Personal income in April rose 0.7% following a 0.5% increase in March. Consensus expectations had been for a 0.6% rise. Disposable personal income increased 0.5% (6.0% y/y) following two months of 0.4% gain. When adjusted for price [...]
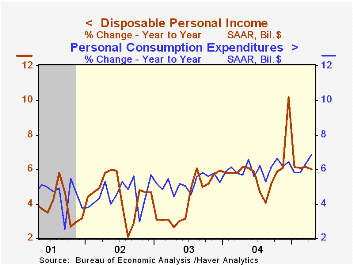
Personal income in April rose 0.7% following a 0.5% increase in March. Consensus expectations had been for a 0.6% rise. Disposable personal income increased 0.5% (6.0% y/y) following two months of 0.4% gain. When adjusted for price inflation take home pay rose 0.1% (3.3% y/y) following a slight decline in March.
Wages & salaries were notably strong and growth during the prior year was upwardly revised. A 0.7% April increase (7.6% y/y) doubled the prior months' increases and year to year growth through March was revised up to 7.6% from 5.8% y/y estimated earlier. Wages in service producing industries surged 0.9% and y/y growth rose to 9.2% versus the 6.4% pace previously estimated. Even factory sector wages showed life and rose 0.5% (6.4% y/y) in April. Year to year growth through March now stands at 7.0%, up from the 5.8% y/y gain estimated last month.
Offsetting some of this strength have been declines in rental income (-14.1% y/y).
Personal consumption increased 0.6% following an upwardly revised 0.9% increase in March. Consensus expectations had been for a 0.8% gain. Durable goods spending rose 0.7% (9.4% y/y) and spending on services rose 0.3% (5.6% y/y) following earlier gains that were revised down.
Nondurables spending surged 1.1% (8.3% y/y) as spending on gasoline & oil jumped 5.5% (25.9% y/y). Spending on clothing recovered 1.5% (5.9% y/y) following the prior month's 2.1% drop.
The PCE chain price index rose 0.4% but less food & energy the 0.1% m/m increase was the slimmest of the year.
| Disposition of Personal Income | April | March | Y/Y | 2004 | 2003 | 2002 |
|---|---|---|---|---|---|---|
| Personal Income | 0.7% | 0.5% | 7.0% | 5.8% | 3.2% | 1.8% |
| Personal Consumption | 0.6% | 0.9% | 6.9% | 6.0% | 5.2% | 4.6% |
| Savings Rate | 0.4% | 0.5% | 1.5% | 1.3% | 1.4% | 2.0% |
| PCE Chain Price Index | 0.4% | 0.5% | 2.7% | 2.2% | 1.9% | 1.4% |
| Less food & energy | 0.1% | 0.3% | 1.6% | 1.5% | 1.3% | 1.8% |

Tom Moeller
AuthorMore in Author Profile »Prior to joining Haver Analytics in 2000, Mr. Moeller worked as the Economist at Chancellor Capital Management from 1985 to 1999. There, he developed comprehensive economic forecasts and interpreted economic data for equity and fixed income portfolio managers. Also at Chancellor, Mr. Moeller worked as an equity analyst and was responsible for researching and rating companies in the economically sensitive automobile and housing industries for investment in Chancellor’s equity portfolio. Prior to joining Chancellor, Mr. Moeller was an Economist at Citibank from 1979 to 1984. He also analyzed pricing behavior in the metals industry for the Council on Wage and Price Stability in Washington, D.C. In 1999, Mr. Moeller received the award for most accurate forecast from the Forecasters' Club of New York. From 1990 to 1992 he was President of the New York Association for Business Economists. Mr. Moeller earned an M.B.A. in Finance from Fordham University, where he graduated in 1987. He holds a Bachelor of Arts in Economics from George Washington University.
More Economy in Brief


