 Global| Dec 11 2009
U.S. Import Prices Jump As Oil Prices Surge
by:Tom Moeller
|in:Economy in Brief
Summary
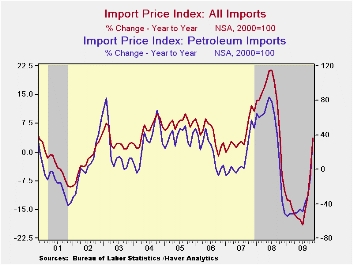
Strength in oil prices was the culprit in the 1.7% jump in overall import prices last month. It exceeded Consensus expectations for a 1.2% increase. Petroleum prices climbed 6.2% to their highest level since October of last year and [...]
 Strength
in
oil prices was the culprit in the 1.7% jump in overall import prices
last month. It exceeded Consensus expectations for a 1.2%
increase.
Strength
in
oil prices was the culprit in the 1.7% jump in overall import prices
last month. It exceeded Consensus expectations for a 1.2%
increase.
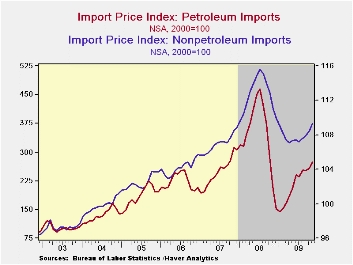
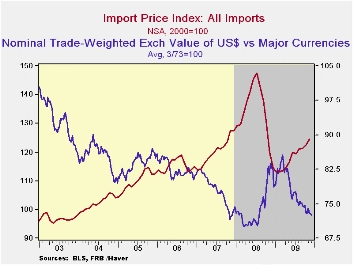
Petroleum prices climbed 6.2% to their highest level since October of last year and have more-than-doubled since the January trough. This month, Brent crude oil prices have moved lower to roughly $71 per barrel from $77 last month. In addition, the latest report from the U.S. Bureau of Labor Statistics indicated that non-oil import prices rose 0.7% after the strong 0.6% October gain. The lower value of the dollar has now helped lift these prices at a 6.5% annual rate during the last three months following a 6.5% y/y decline as of August. (During the last ten years, there has been a negative 81% correlation between the nominal trade-weighted exchange value of the US dollar vs. major currencies and the y/y change in non-oil import prices.)
 Import
prices break down as
follows: Chemical import prices have been strong during the last three
months, rising at a 26.5% annual rate. Iron & steel prices also
have been strong rising at a 42.6% rate since August. Food prices
increased at a 5.2% rate during the last three months while capital
goods prices posted a modest 1.3% increase (AR) after having been
little-changed from March through August. Prices for nonauto consumer
goods remained weak, down 0.1% last month and up at a 0.4% during the
last three. Durable consumer goods prices rose rose at a 1.4% annual
rate over the last three months, though that is improved from a 6.5%
rate of decline early this year. Furniture prices continued down to the
lowest level since April of last year (-1.5% y/y). Apparel prices have
been flat since July (-0.5% y/y).
Import
prices break down as
follows: Chemical import prices have been strong during the last three
months, rising at a 26.5% annual rate. Iron & steel prices also
have been strong rising at a 42.6% rate since August. Food prices
increased at a 5.2% rate during the last three months while capital
goods prices posted a modest 1.3% increase (AR) after having been
little-changed from March through August. Prices for nonauto consumer
goods remained weak, down 0.1% last month and up at a 0.4% during the
last three. Durable consumer goods prices rose rose at a 1.4% annual
rate over the last three months, though that is improved from a 6.5%
rate of decline early this year. Furniture prices continued down to the
lowest level since April of last year (-1.5% y/y). Apparel prices have
been flat since July (-0.5% y/y).
 Total
export prices rose a firm 0.8% and at a 3.4% annual rate during the
last three months. The gain was led by a 0.7% rise in nonagricultural
export prices which have turned up versus last year after a 6.6% y/y
decline as of July. Agricultural export prices jumped 3.7% (0.6% y/y).
Total
export prices rose a firm 0.8% and at a 3.4% annual rate during the
last three months. The gain was led by a 0.7% rise in nonagricultural
export prices which have turned up versus last year after a 6.6% y/y
decline as of July. Agricultural export prices jumped 3.7% (0.6% y/y).
The import and export price series can be found in Haver's USECON database. Detailed figures are available in the USINT database.
| Import/Export Prices (NSA, %) | November | October | September | Y/Y | 2008 | 2007 | 2006 |
|---|---|---|---|---|---|---|---|
| Import - All Commodities | 1.7 | 0.8 | 0.2 | 3 .7 | 11.5 | 4.2 | 4.9 |
| Petroleum | 6.2 | 2.9 | -0.6 | 35.5 | 37.7 | 11.6 | 20.6 |
| Nonpetroleum | 0.7 | 0.6 | 0.3 | -1.6 | 5.3 | 2.7 | 1.7 |
| Export - All Commodities | 0.8 | 0.2 | -0.2 | 0.6 | 6.0 | 4.9 | 3.6 |

Tom Moeller
AuthorMore in Author Profile »Prior to joining Haver Analytics in 2000, Mr. Moeller worked as the Economist at Chancellor Capital Management from 1985 to 1999. There, he developed comprehensive economic forecasts and interpreted economic data for equity and fixed income portfolio managers. Also at Chancellor, Mr. Moeller worked as an equity analyst and was responsible for researching and rating companies in the economically sensitive automobile and housing industries for investment in Chancellor’s equity portfolio. Prior to joining Chancellor, Mr. Moeller was an Economist at Citibank from 1979 to 1984. He also analyzed pricing behavior in the metals industry for the Council on Wage and Price Stability in Washington, D.C. In 1999, Mr. Moeller received the award for most accurate forecast from the Forecasters' Club of New York. From 1990 to 1992 he was President of the New York Association for Business Economists. Mr. Moeller earned an M.B.A. in Finance from Fordham University, where he graduated in 1987. He holds a Bachelor of Arts in Economics from George Washington University.
More Economy in Brief


