 Global| Aug 13 2009
U.S. Import Prices Decline With Drop In Oil And Other Prices
by:Tom Moeller
|in:Economy in Brief
Summary
U.S. import prices last month declined a slightly more-than-expected 0.7%. Prices have fallen sharply since last year due to lower oil prices, the firmer dollar and the global economic recession. The recent gain in petroleum prices [...]
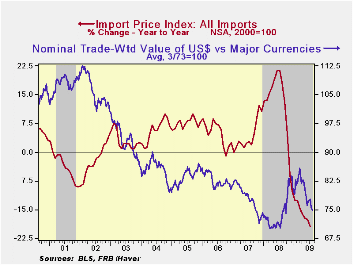
U.S. import prices last month declined a slightly more-than-expected 0.7%. Prices have fallen sharply since last year due to lower oil prices, the firmer dollar and the global economic recession.
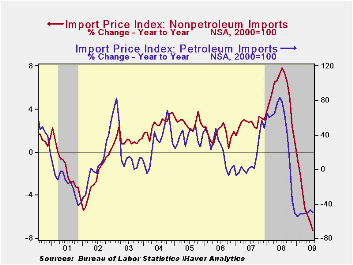
The recent gain in petroleum prices took a breather last month and fell 2.8% after four consecutive months of double-digit increase. This month, however, crude oil prices have more than reversed the earlier decline with a rise to an average $71.75 per barrel.
Non-oil import prices reversed course last month with a 0.2% decline and since March prices have been roughly unchanged. This stability compares to three-month price declines of 3.5% as recently as this past January. (During the last ten years, there has been a negative 81% correlation between the nominal trade-weighted exchange value of the US dollar vs. major currencies and the y/y change in non-oil import prices.)
 Food prices took an about face last month with a 0.8% decline
(-7.3% y/y) that reversed the gains during the prior two months. Prices
for nonauto consumer goods fell 0.4% (-1.2% y/y). Durable consumer
goods prices fell 0.3% (-1.6% y/y) as household goods fell and home
entertainment equipment prices also were down by 1.4% y/y. Apparel
prices reversed earlier stability and continued down with a 0.5% flop
(-0.6% y/y).
Food prices took an about face last month with a 0.8% decline
(-7.3% y/y) that reversed the gains during the prior two months. Prices
for nonauto consumer goods fell 0.4% (-1.2% y/y). Durable consumer
goods prices fell 0.3% (-1.6% y/y) as household goods fell and home
entertainment equipment prices also were down by 1.4% y/y. Apparel
prices reversed earlier stability and continued down with a 0.5% flop
(-0.6% y/y).
 Capital goods import prices during July increased a modest
0.2% (-1.5% y/y) after little change during the prior three months.
Excluding computers, capital goods prices rose 0.2% but they're still
down 0.3% y/y. Prices of computers, peripherals & accessories
inched up 0.3% but they're down 4.8% during the last year.
Capital goods import prices during July increased a modest
0.2% (-1.5% y/y) after little change during the prior three months.
Excluding computers, capital goods prices rose 0.2% but they're still
down 0.3% y/y. Prices of computers, peripherals & accessories
inched up 0.3% but they're down 4.8% during the last year.
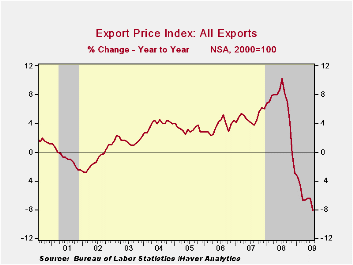
Total export prices reversed some of their earlier strengthening with a 0.3% decline. The latest overall drop was led by a 4.9% (-22.3% y/y) decline in agricultural prices which reversed all of the June increase. Nonagricultural export prices firmed again and posted a 0.2% uptick but they're still down 6.5% y/y.
| Import/Export Prices (NSA, %) | July | June | Y/Y | 2008 | 2007 | 2006 |
|---|---|---|---|---|---|---|
| Import - All Commodities | -0.7 | 2.6 | -19.3 | 11.5 | 4.2 | 4.9 |
| Petroleum | -2.8 | 16.2 | -49.9 | 37.7 | 11.6 | 20.6 |
| Nonpetroleum | -0.2 | 0.2 | -7.3 | 5.3 | 2.7 | 1.7 |
| Export - All Commodities | -0.3 | 1.0 | -8.1 | 6.0 | 4.9 | 3.6 |

Tom Moeller
AuthorMore in Author Profile »Prior to joining Haver Analytics in 2000, Mr. Moeller worked as the Economist at Chancellor Capital Management from 1985 to 1999. There, he developed comprehensive economic forecasts and interpreted economic data for equity and fixed income portfolio managers. Also at Chancellor, Mr. Moeller worked as an equity analyst and was responsible for researching and rating companies in the economically sensitive automobile and housing industries for investment in Chancellor’s equity portfolio. Prior to joining Chancellor, Mr. Moeller was an Economist at Citibank from 1979 to 1984. He also analyzed pricing behavior in the metals industry for the Council on Wage and Price Stability in Washington, D.C. In 1999, Mr. Moeller received the award for most accurate forecast from the Forecasters' Club of New York. From 1990 to 1992 he was President of the New York Association for Business Economists. Mr. Moeller earned an M.B.A. in Finance from Fordham University, where he graduated in 1987. He holds a Bachelor of Arts in Economics from George Washington University.
More Economy in Brief


